The same sample client, in RCReports and in WageProof
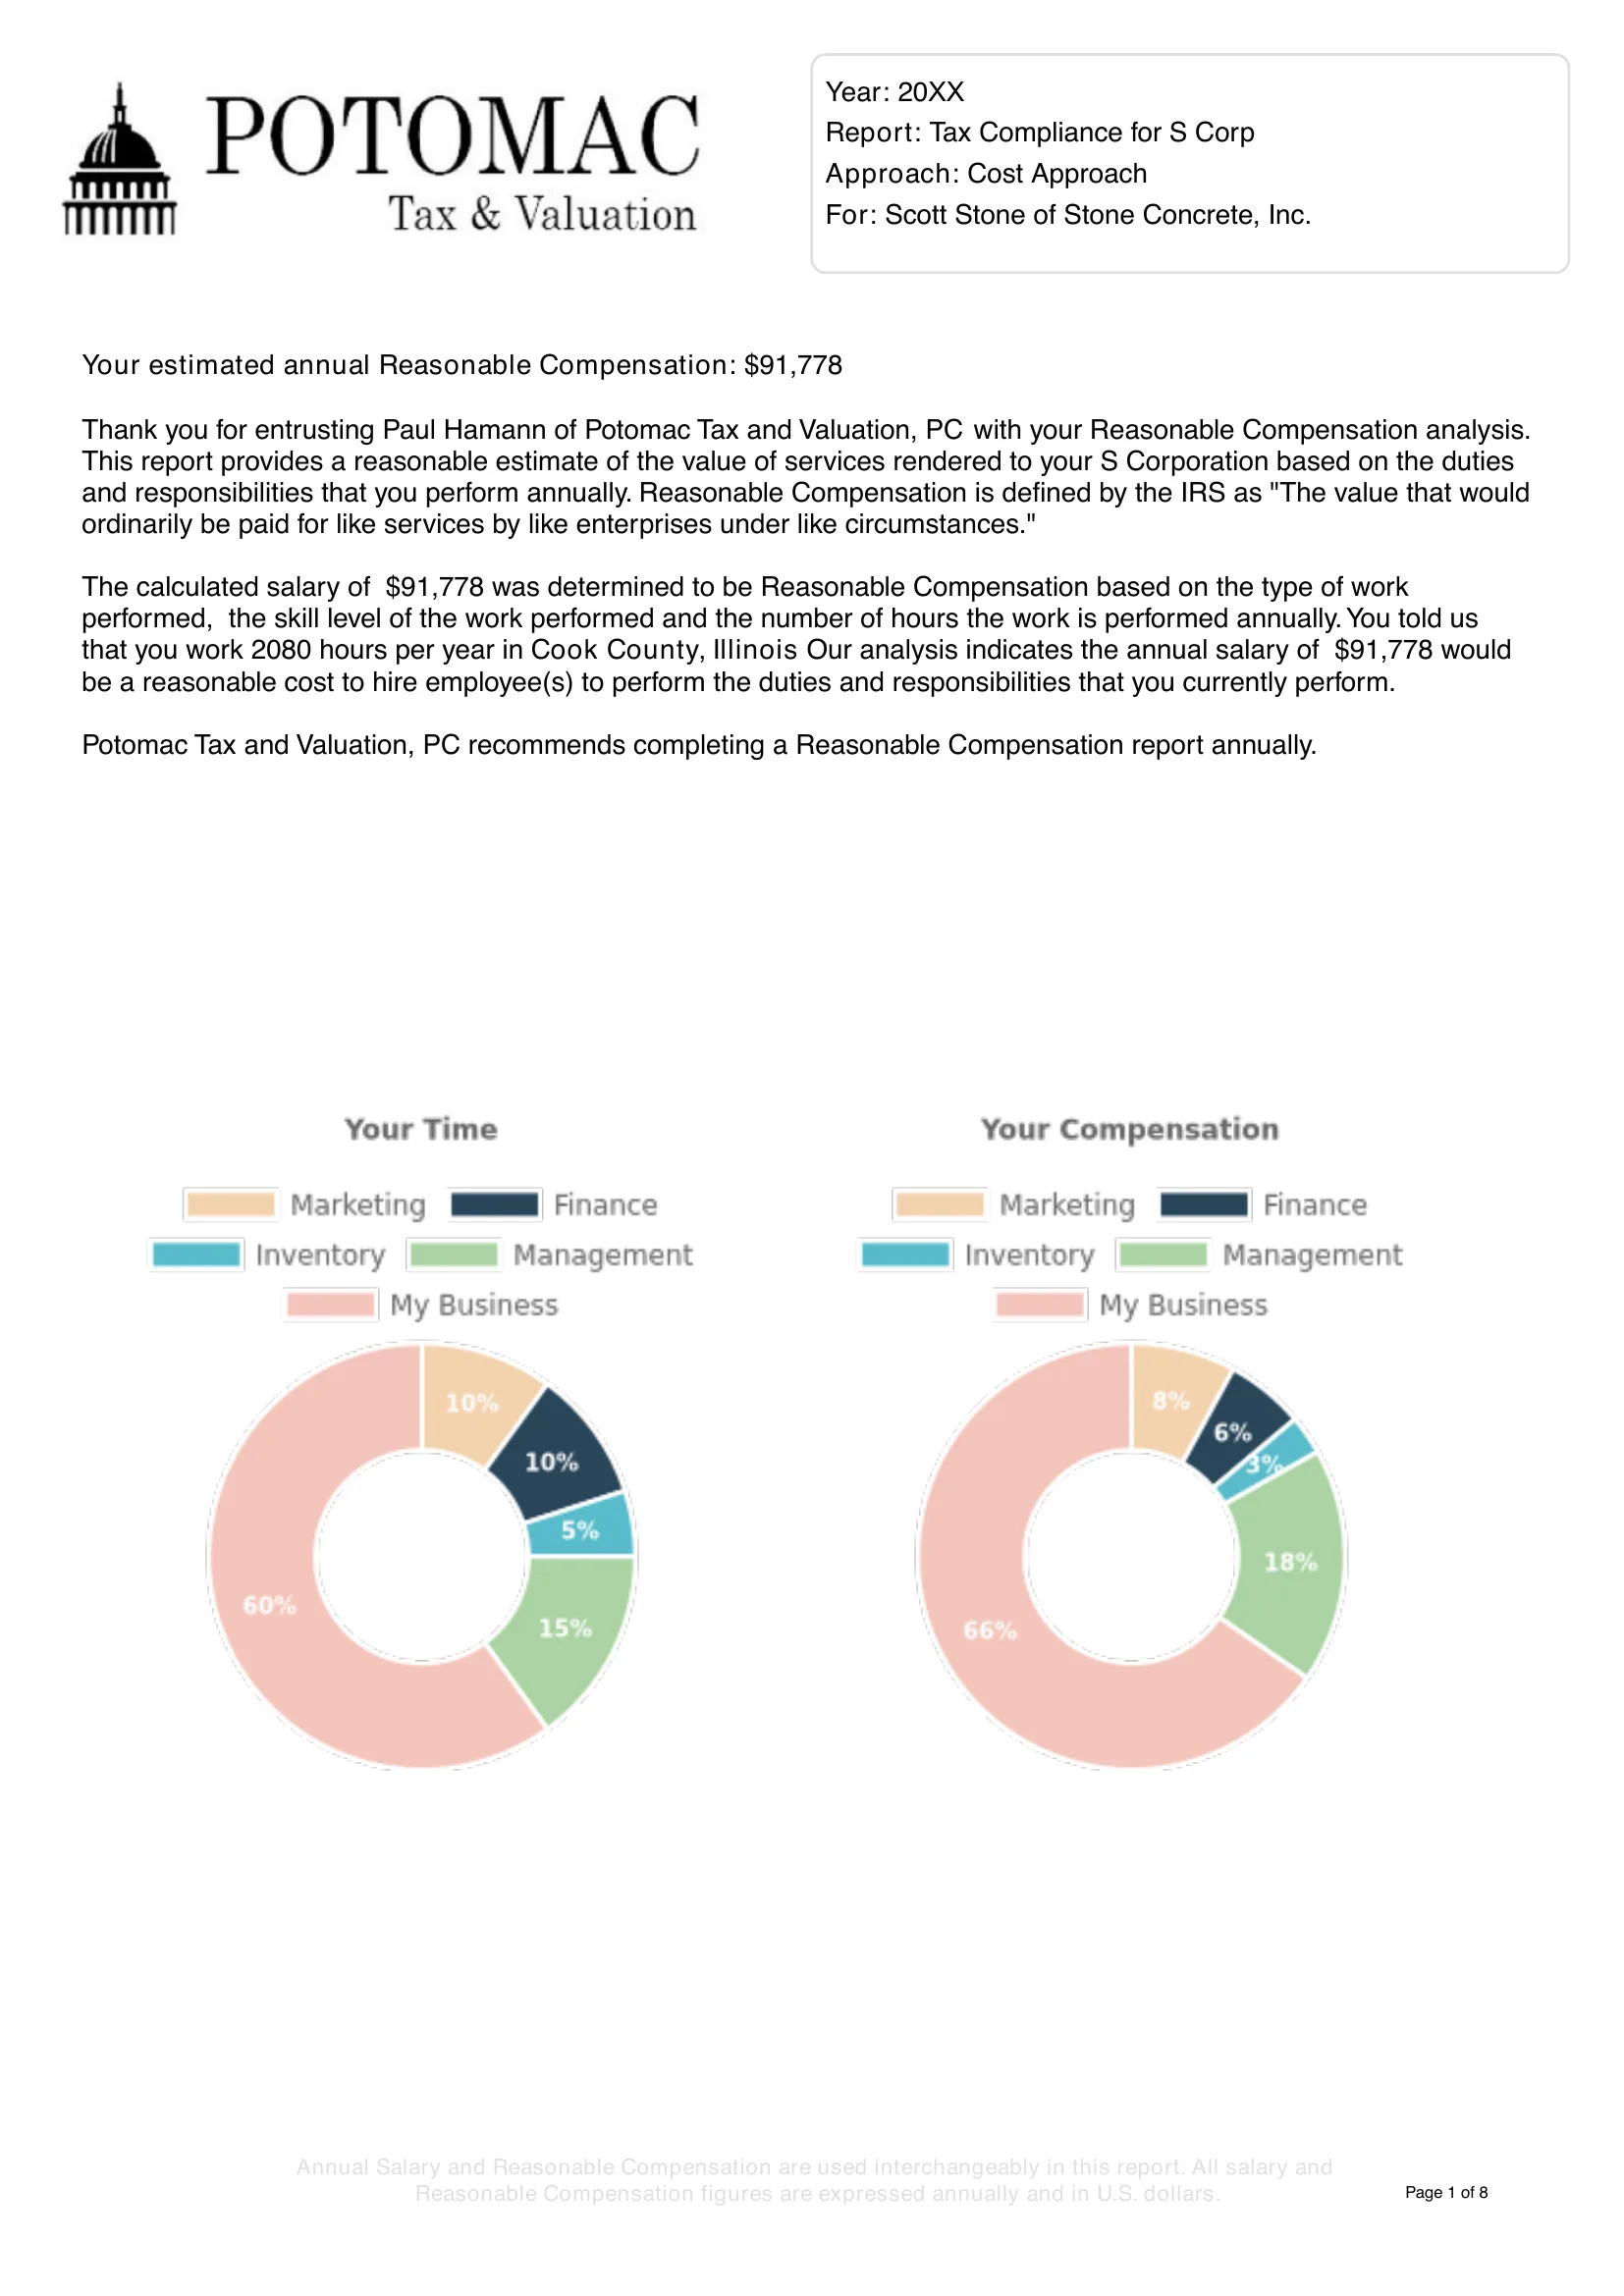
RCReports’ public sample client, entered in WageProof with the same tasks, hours and county.
RCReports
WageProof
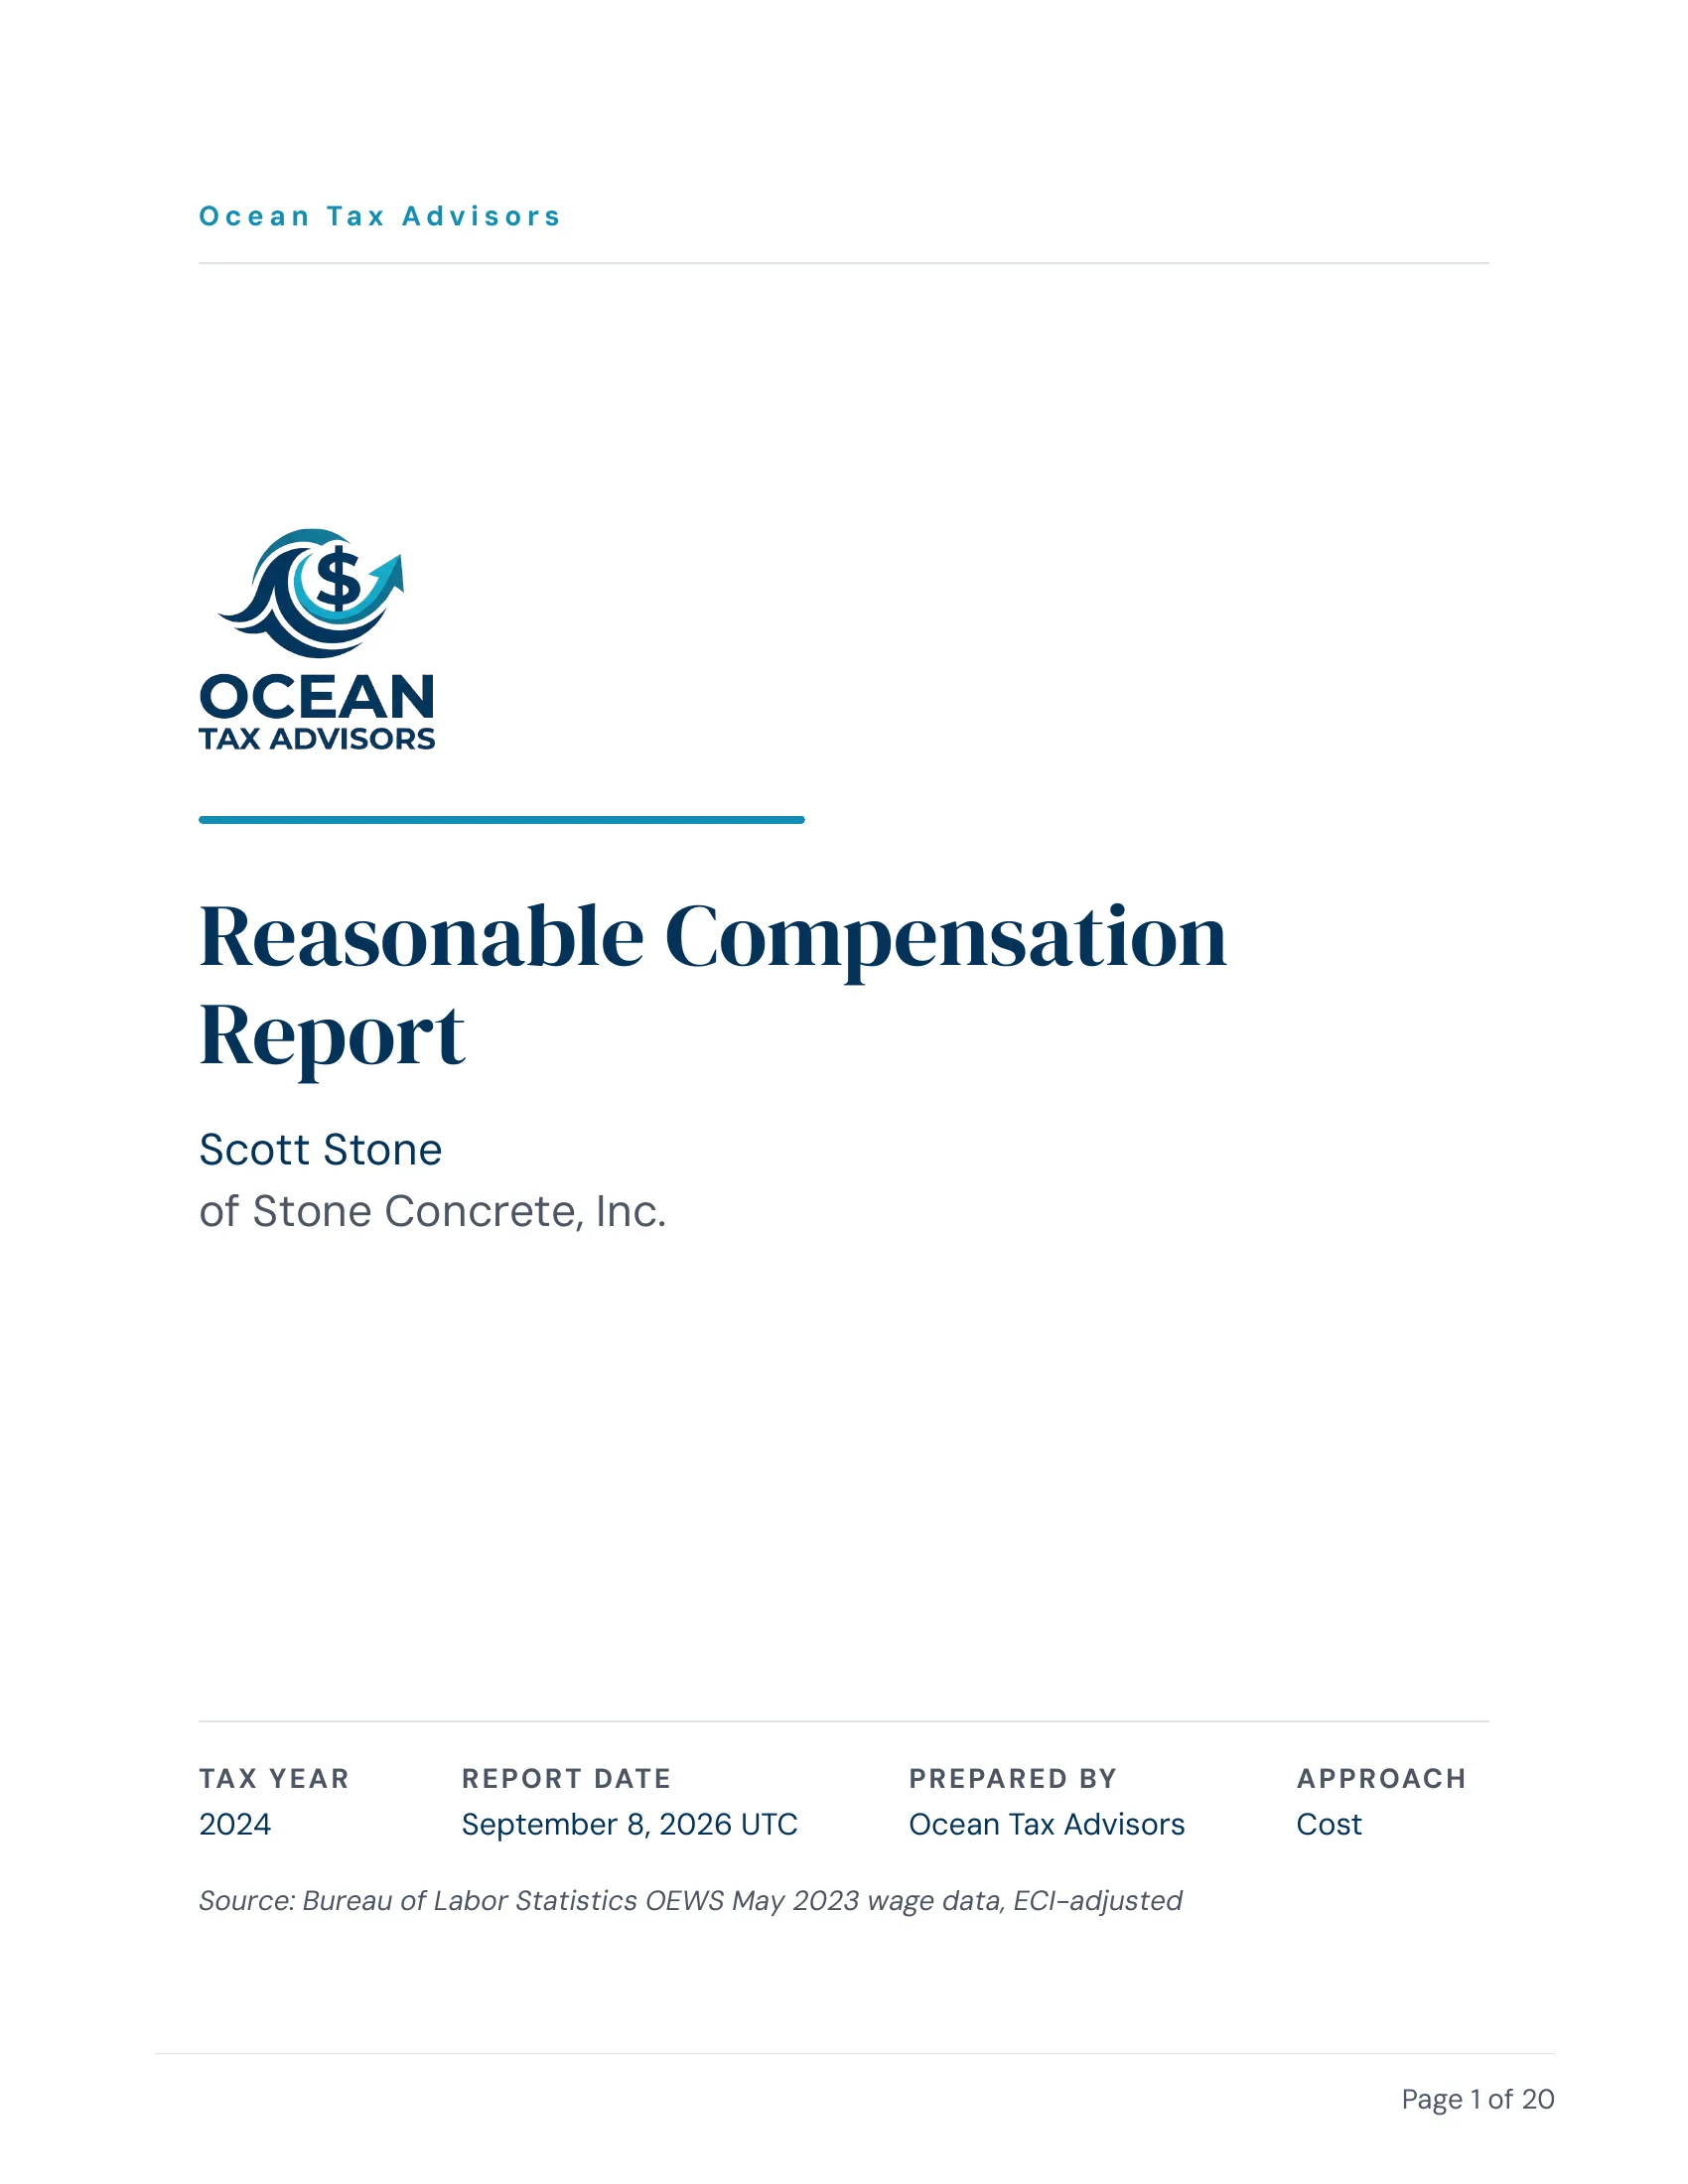
Page 1 of each report
Which report would you rather hand a client?
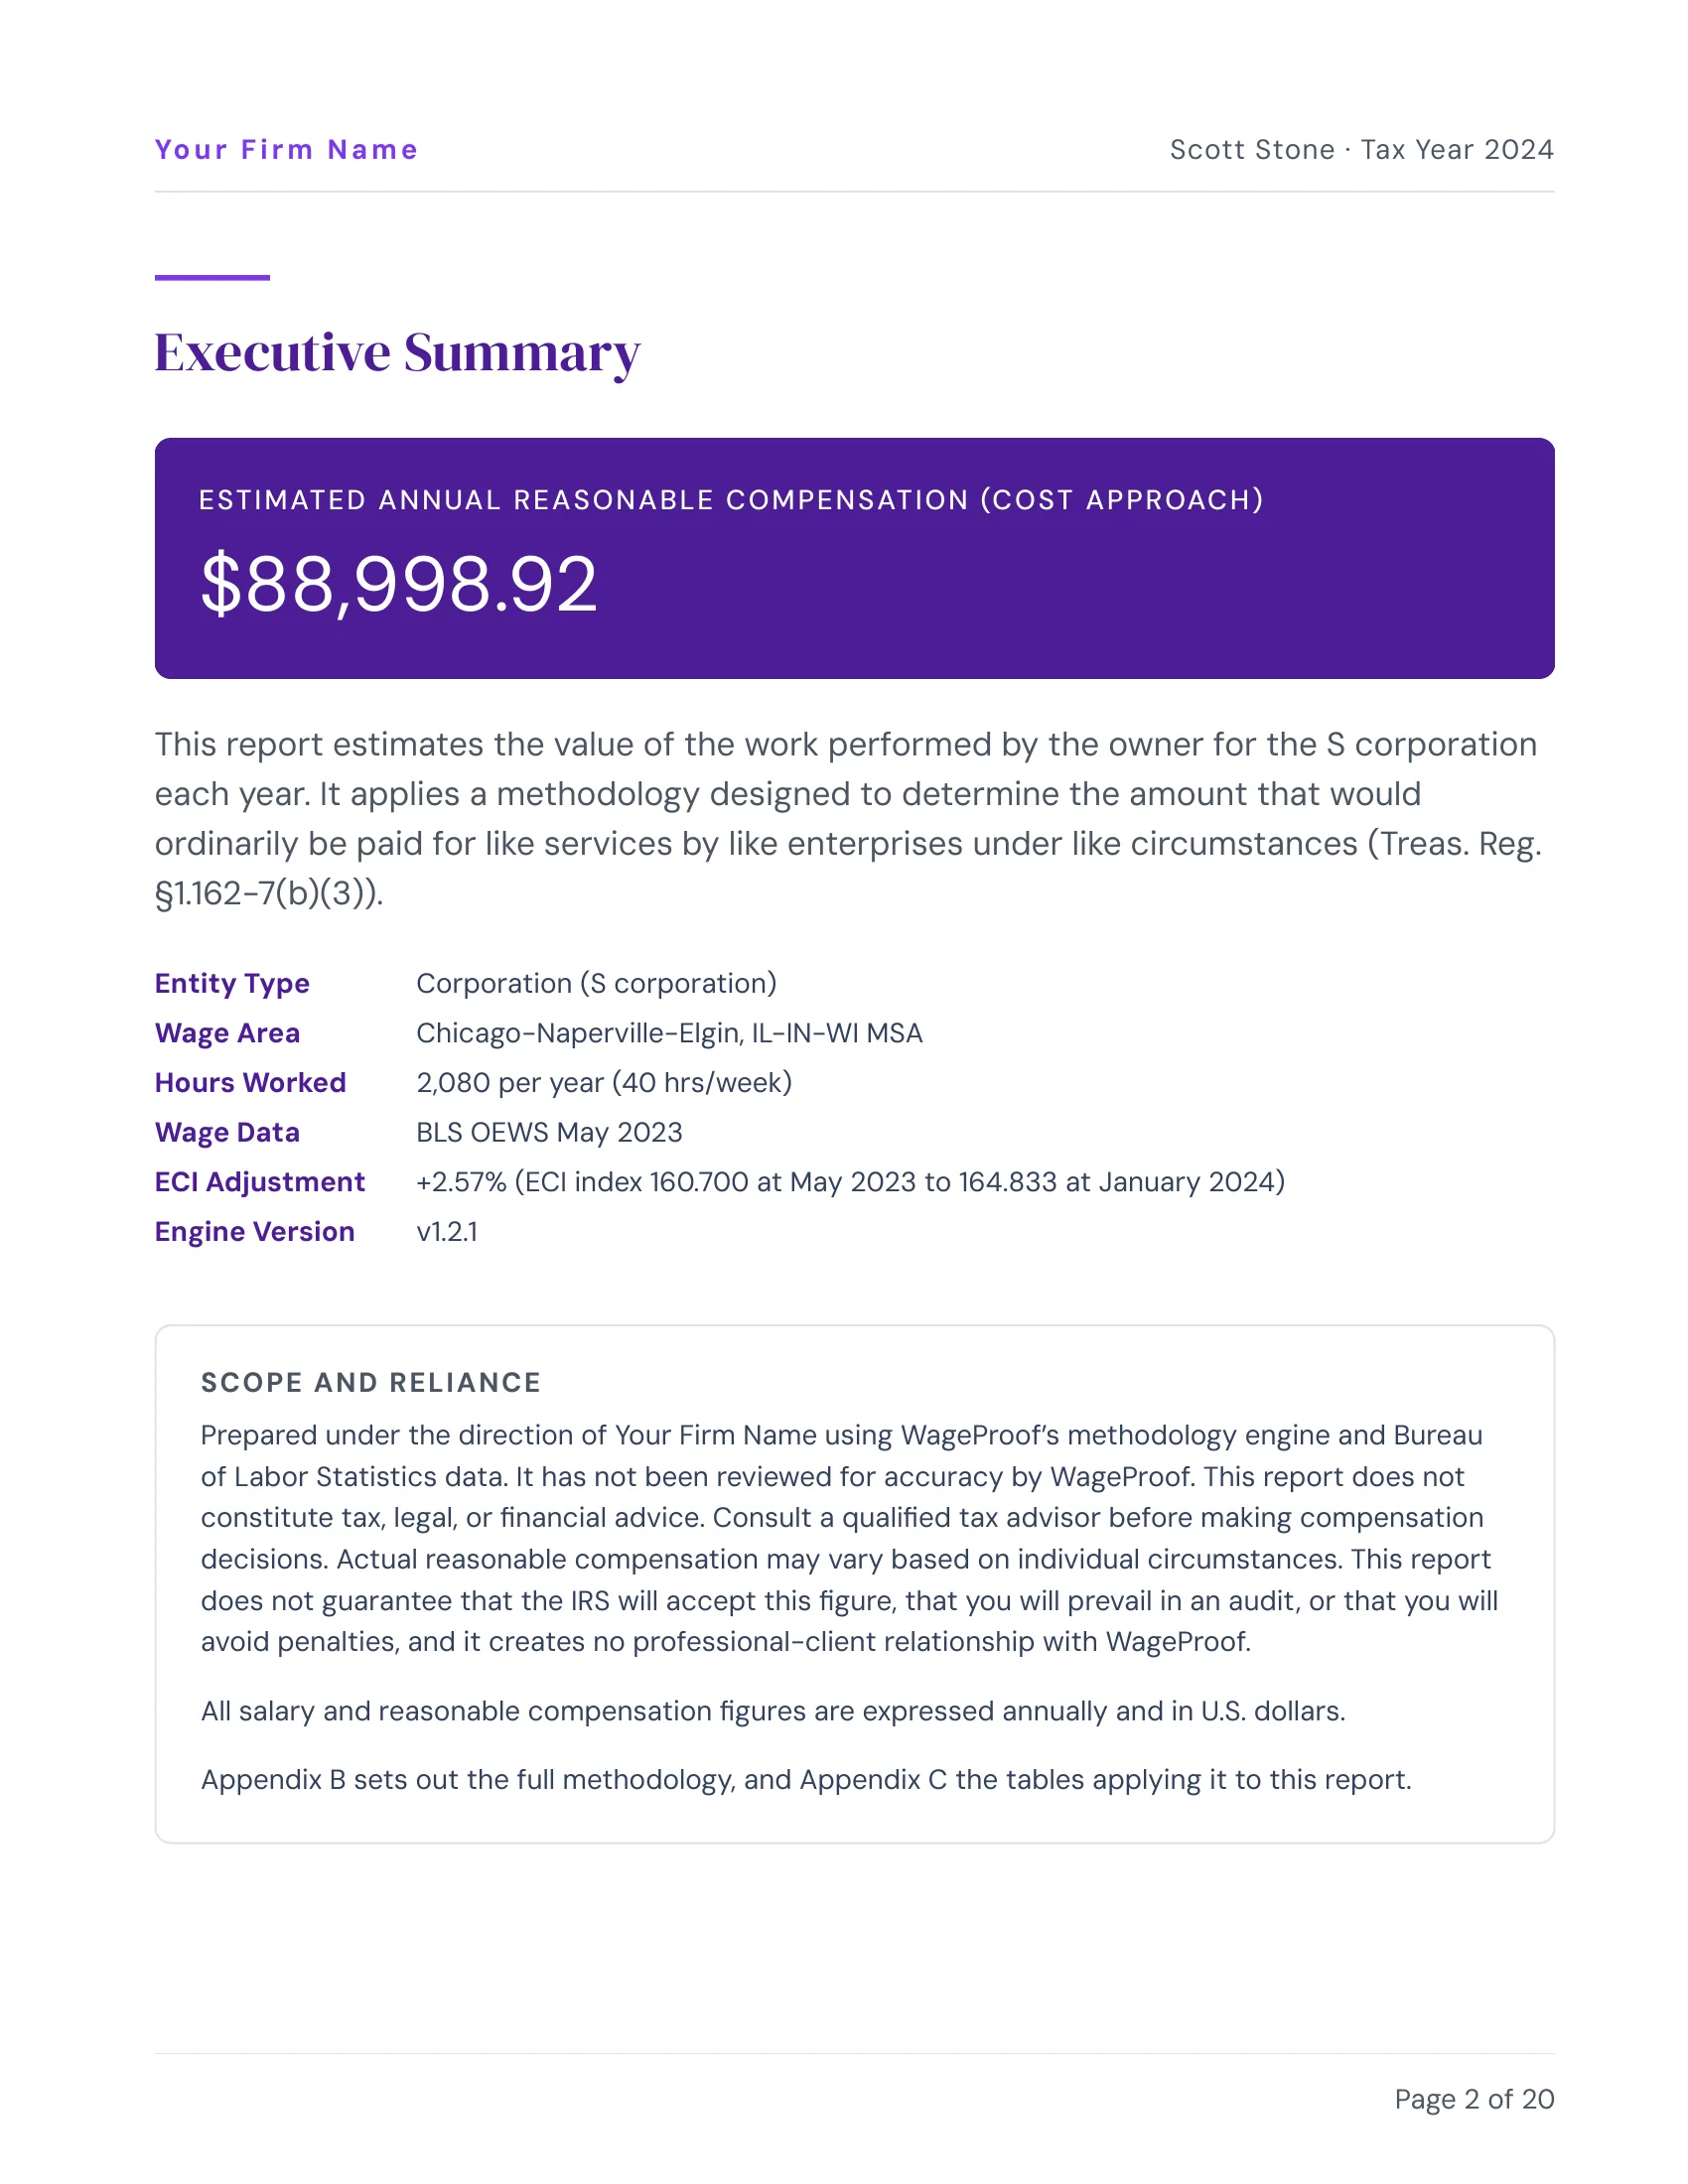
Put your firm’s logo on the cover and your colors on every page of the report. Take a look at the two reports below to see the difference.
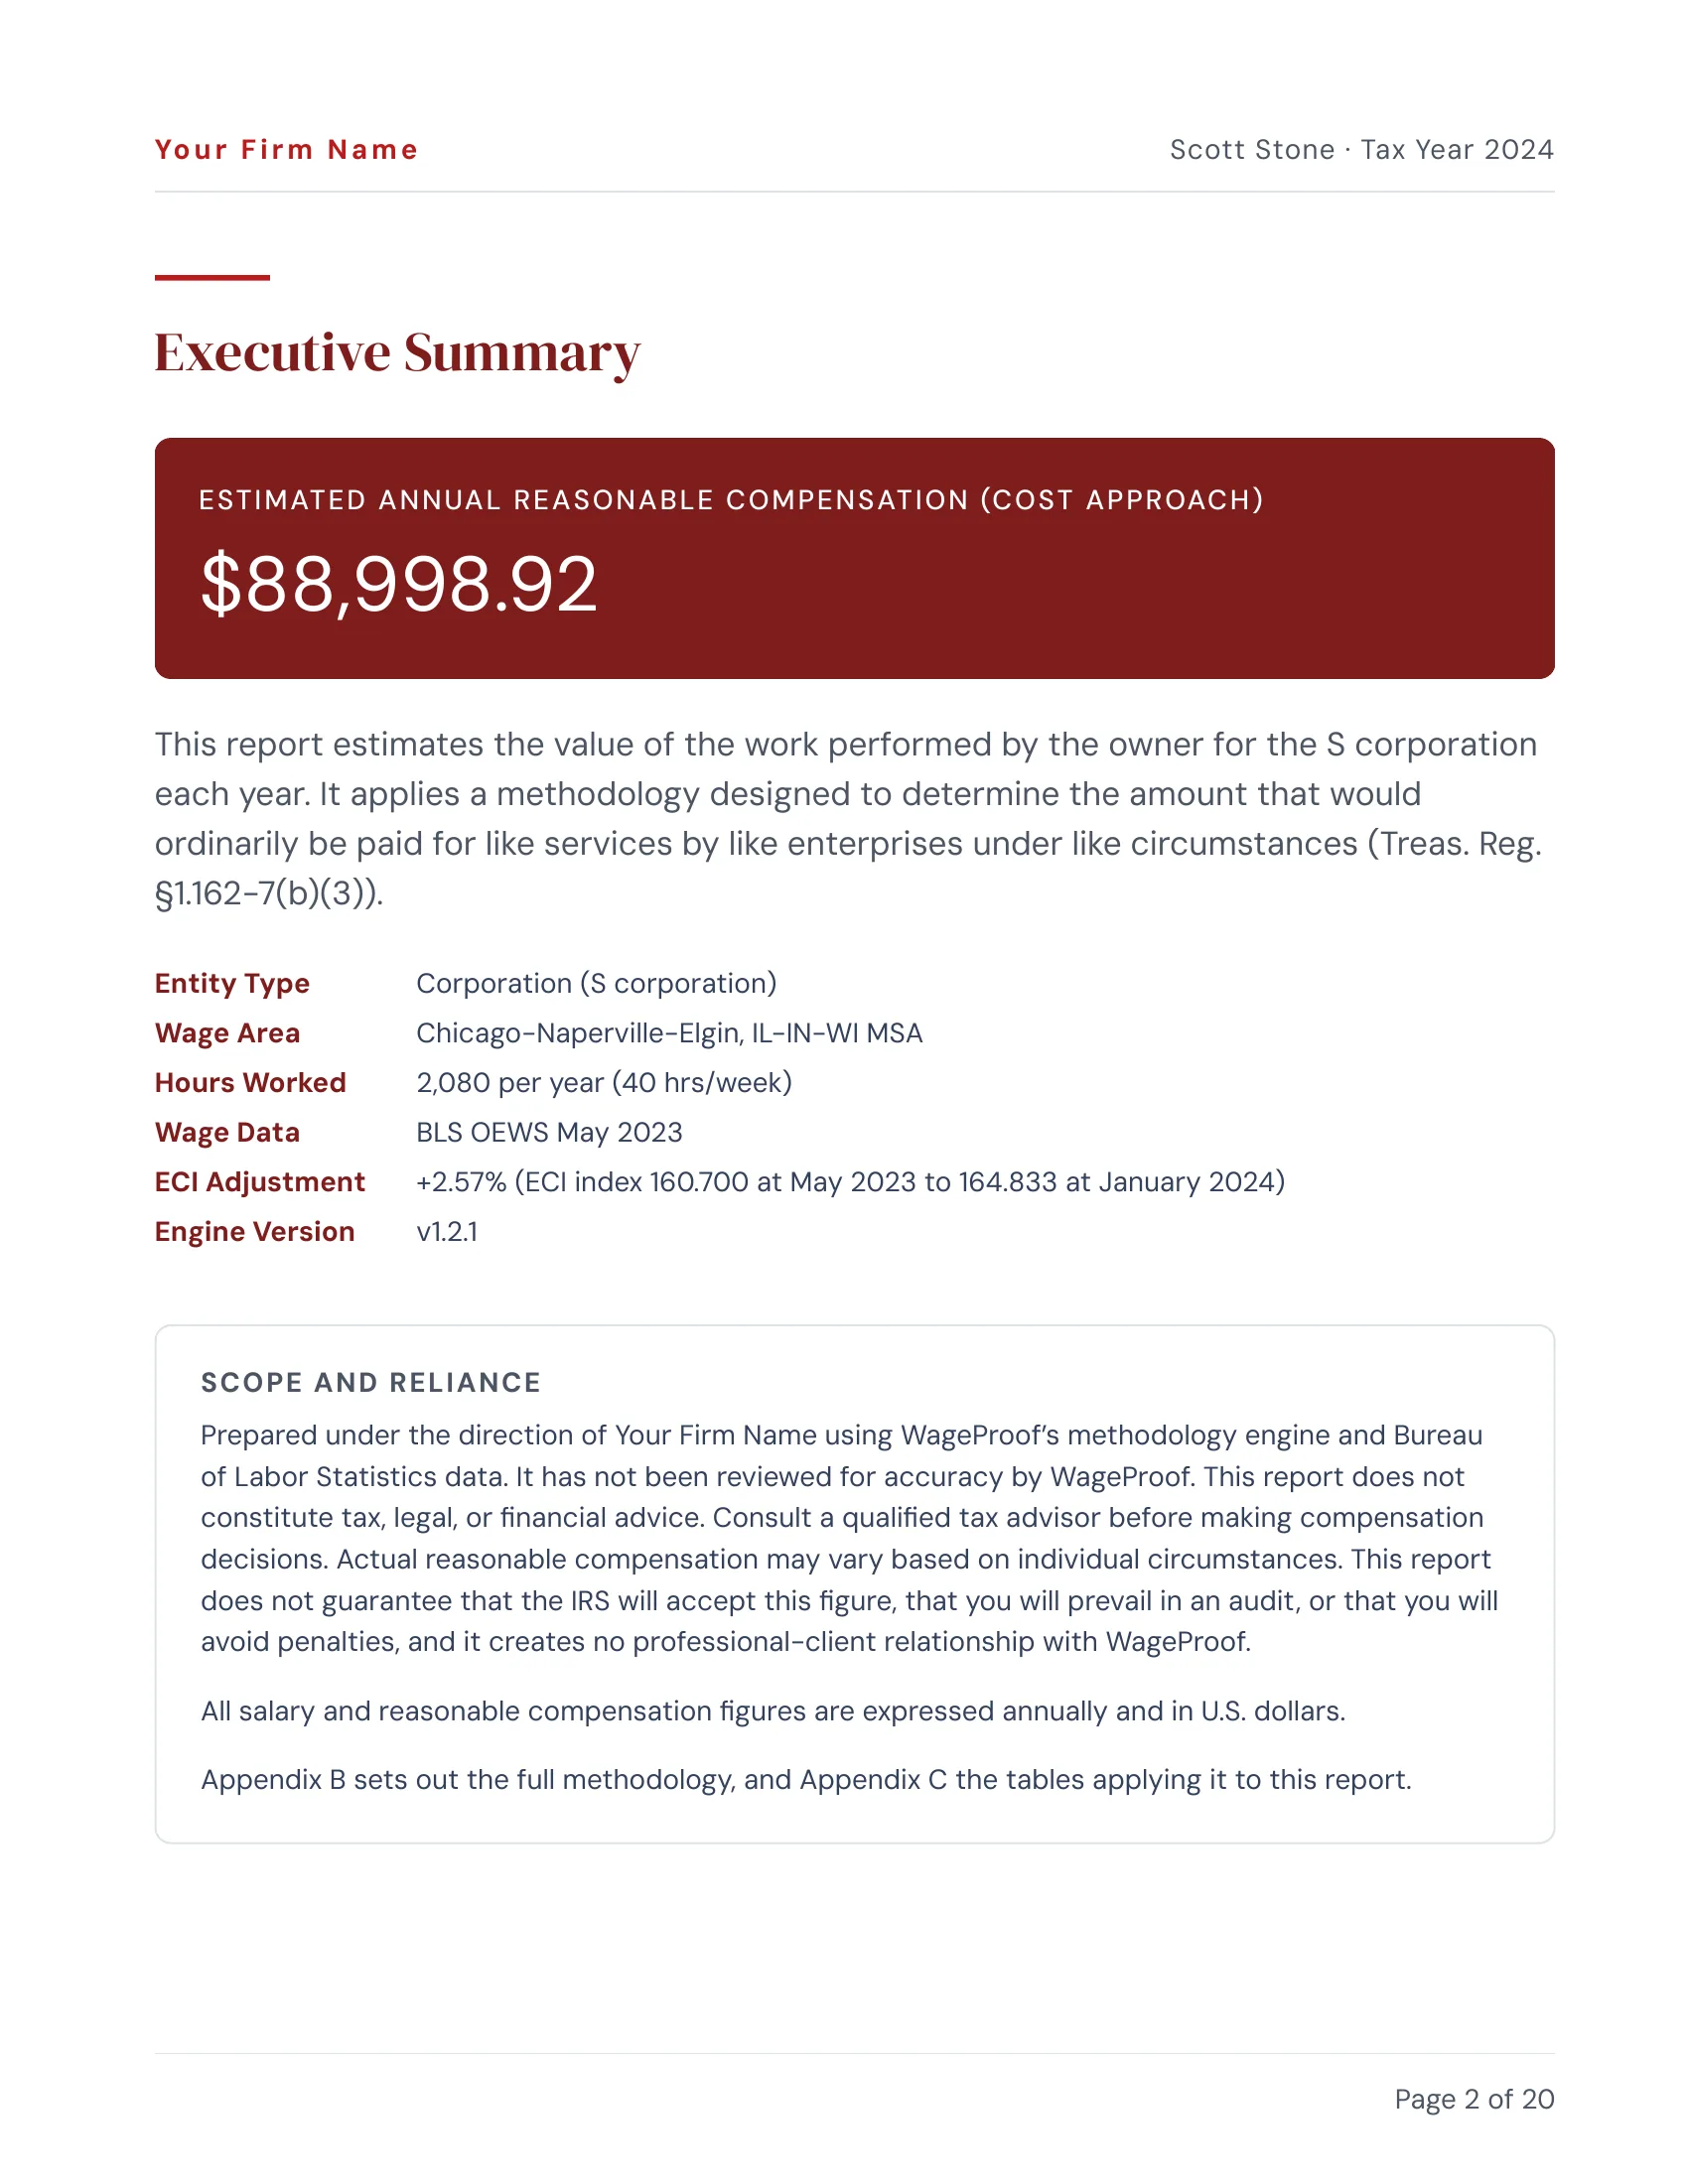
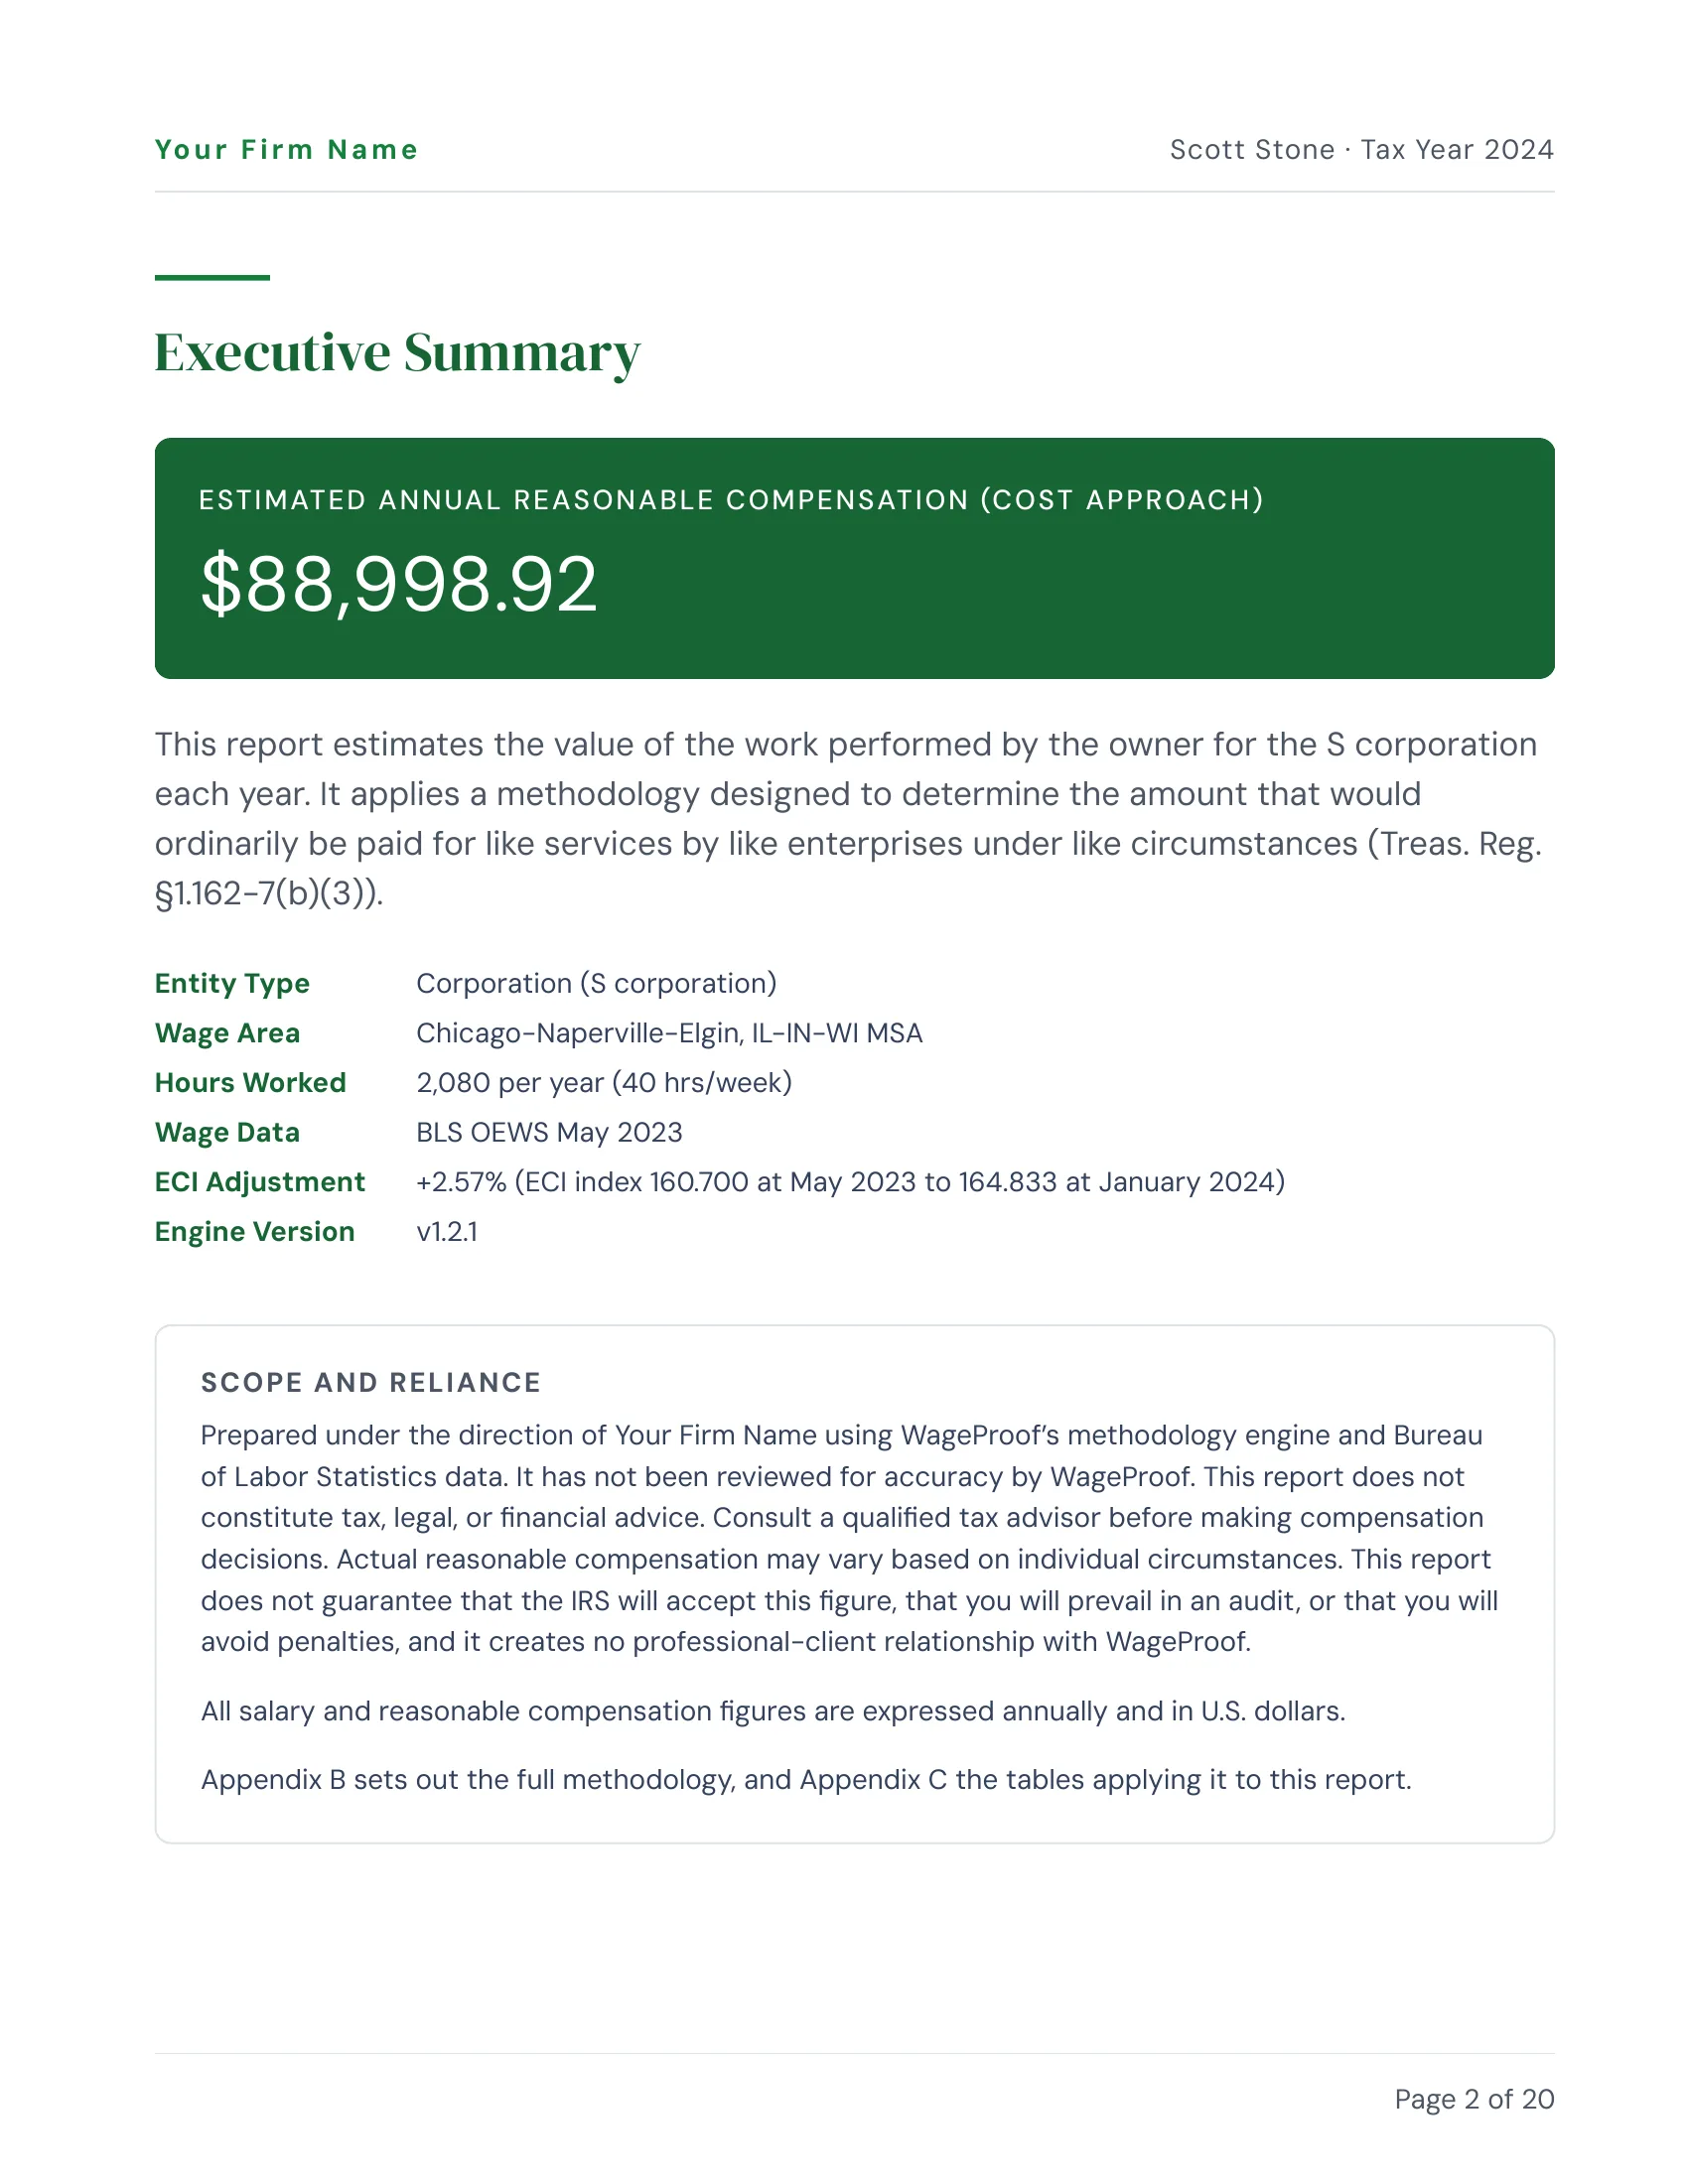
With WageProof, you can choose your firm’s colors to customize your report
Enter the exact hex codes for your firm’s primary and accent colors, so every page of the report matches your brand.
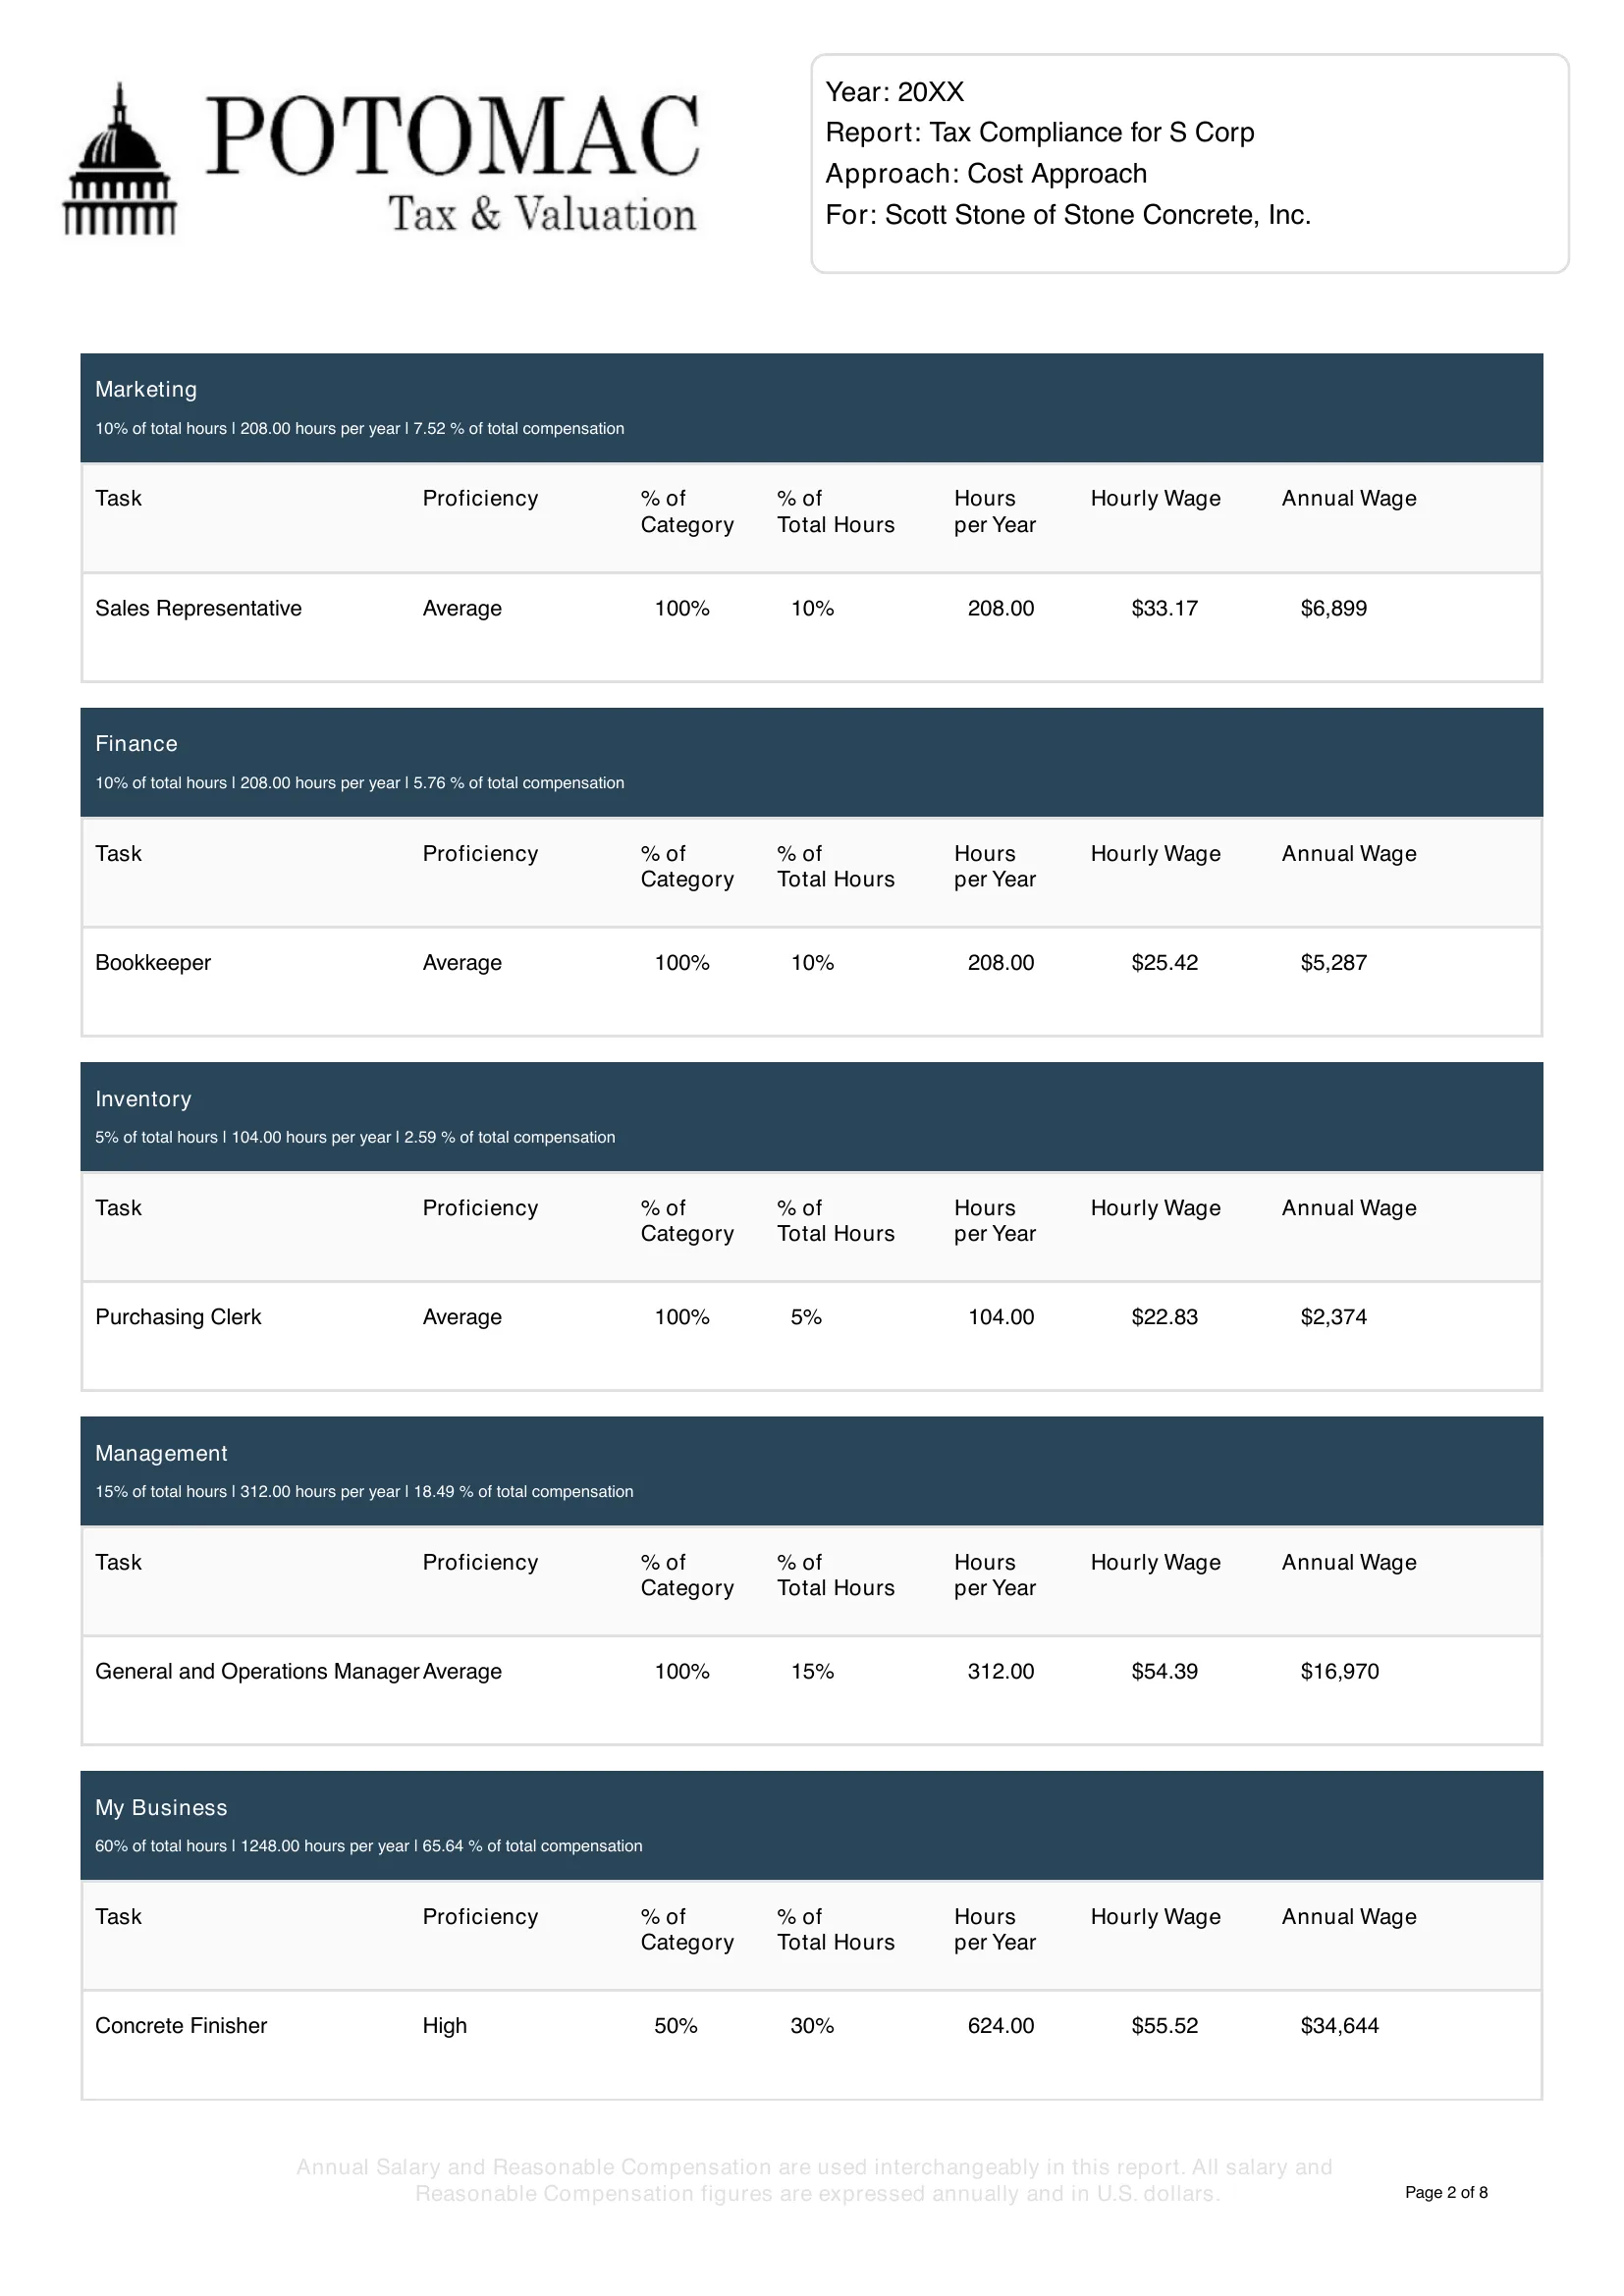
The task page
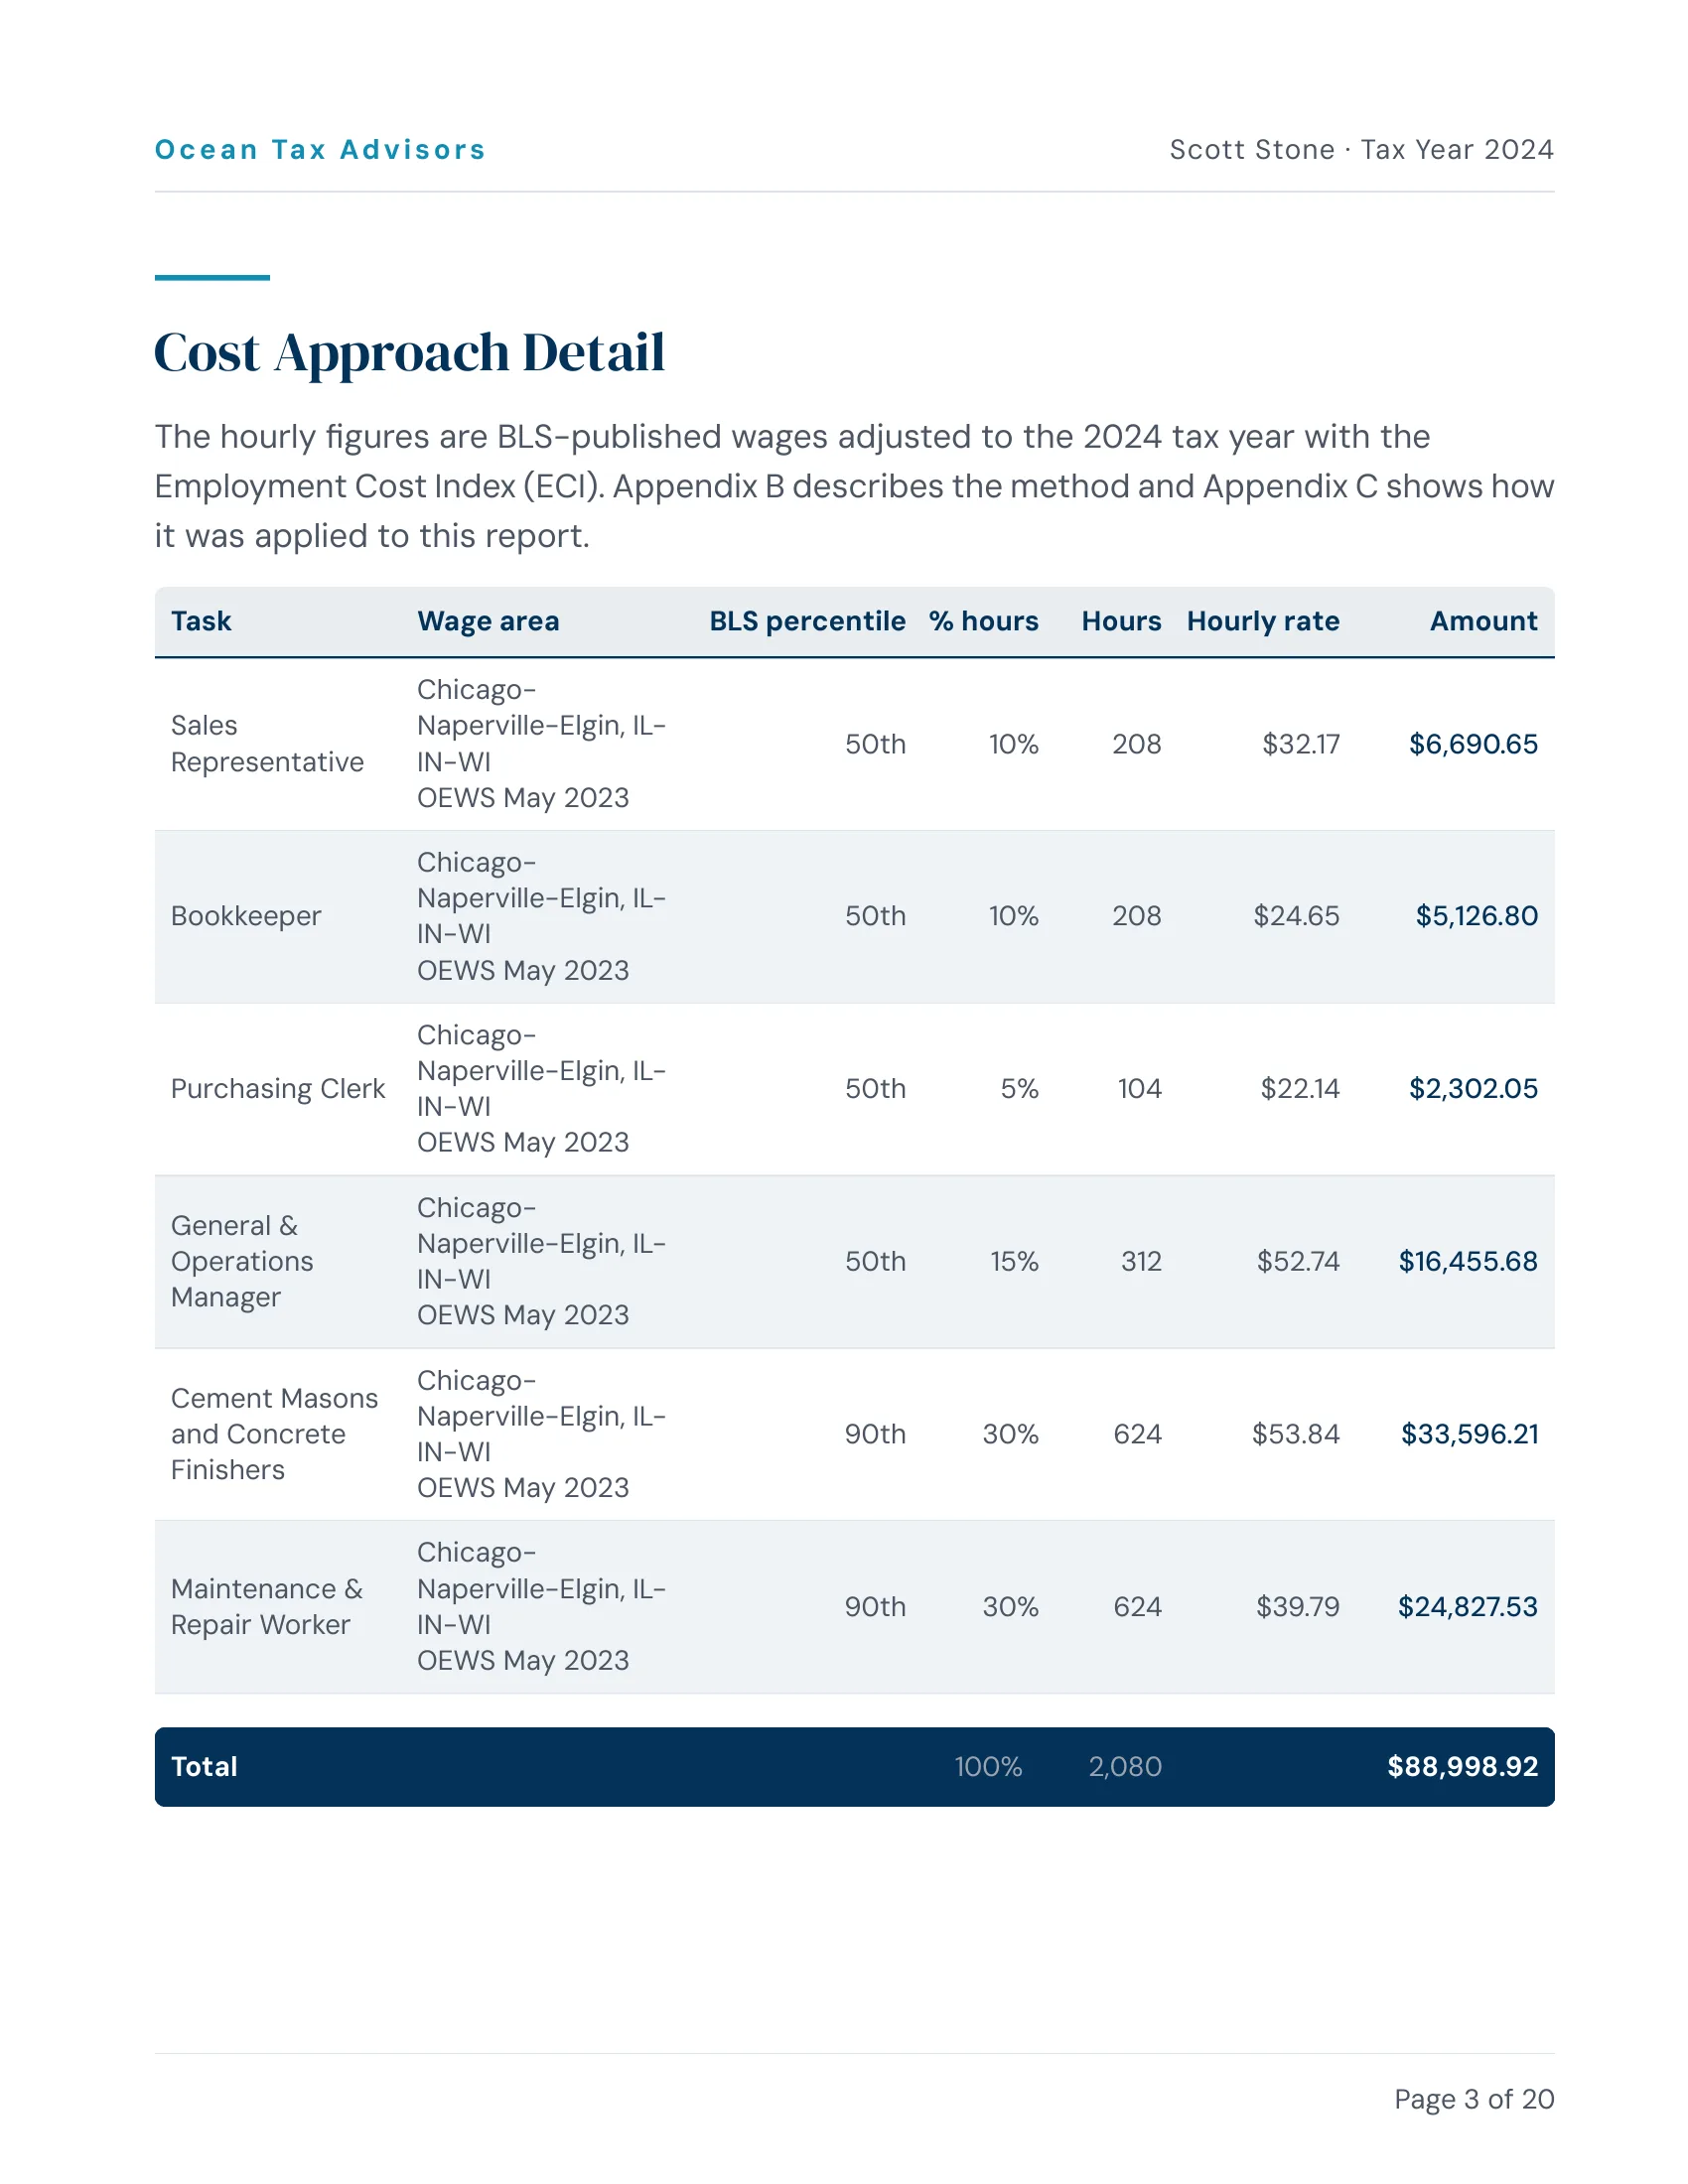
Each report’s wage breakdown
With WageProof, you can see the exact origin of every wage.
The method
In an audit, you can show where every number came from
RCReports doesn’t publish its exact method, and its report doesn’t show how each figure was built.
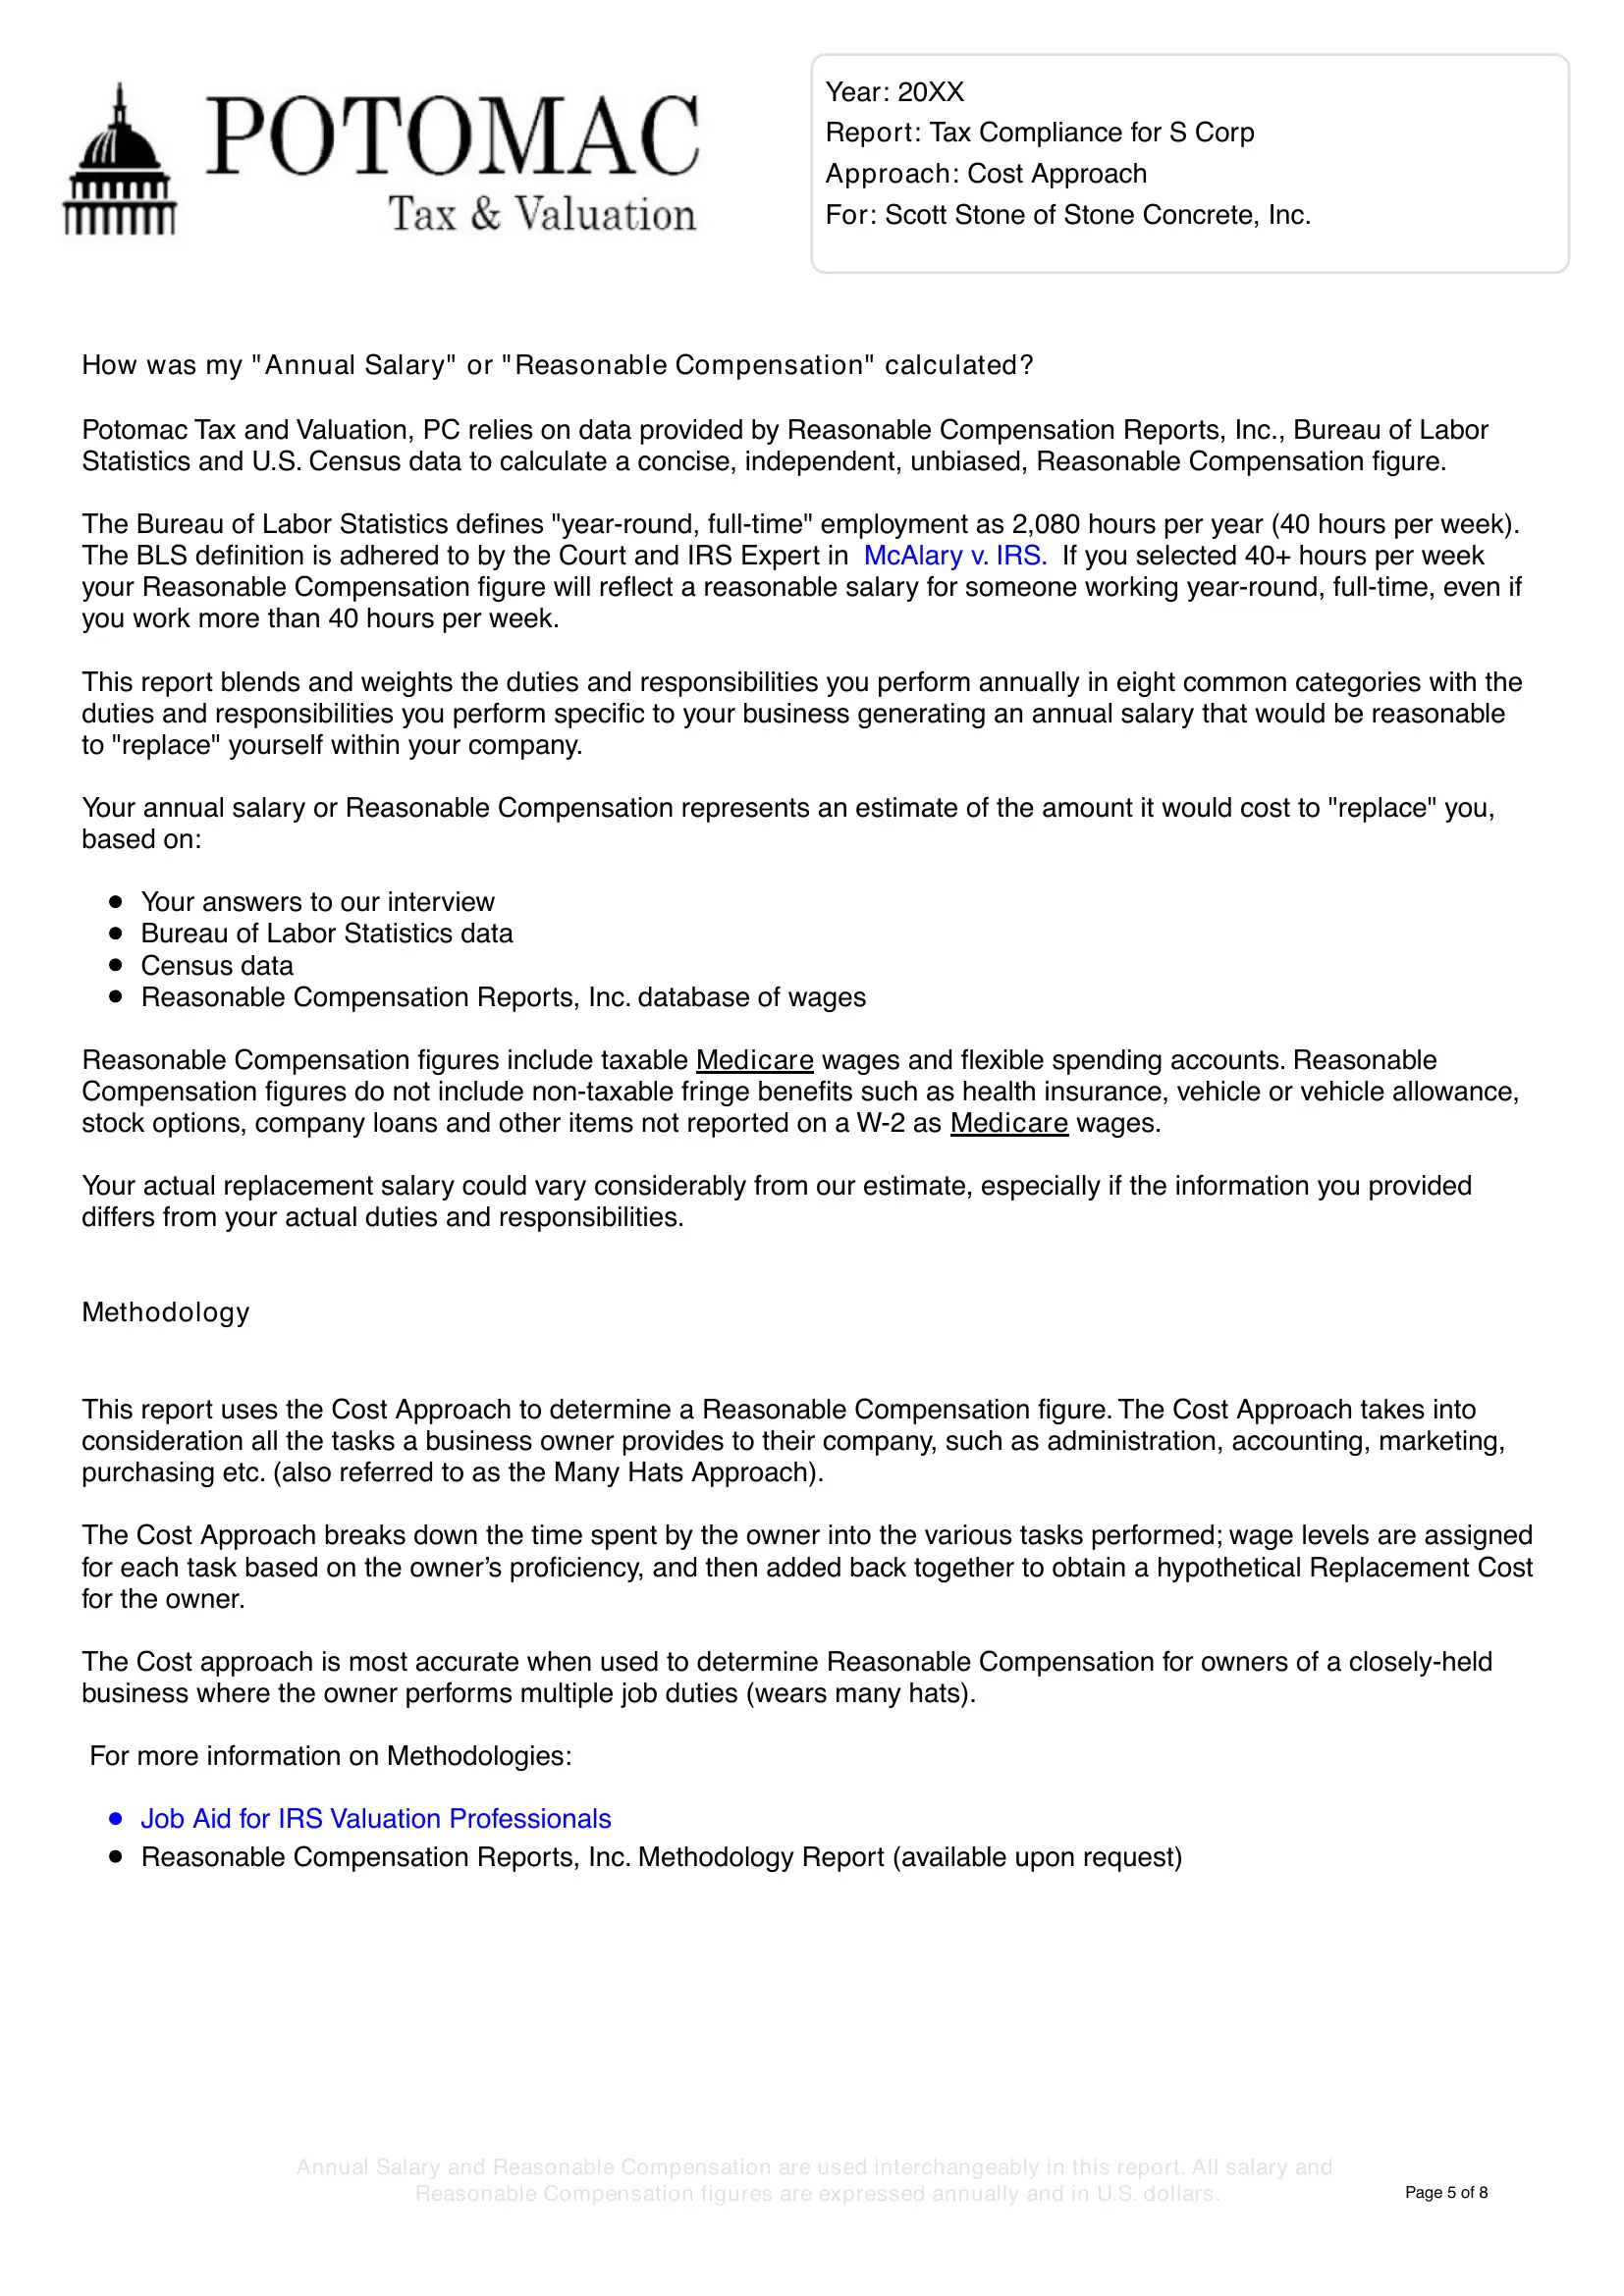
Every WageProof report shows exactly how each figure was worked out, so an auditor can check each step instead of taking our word for it.
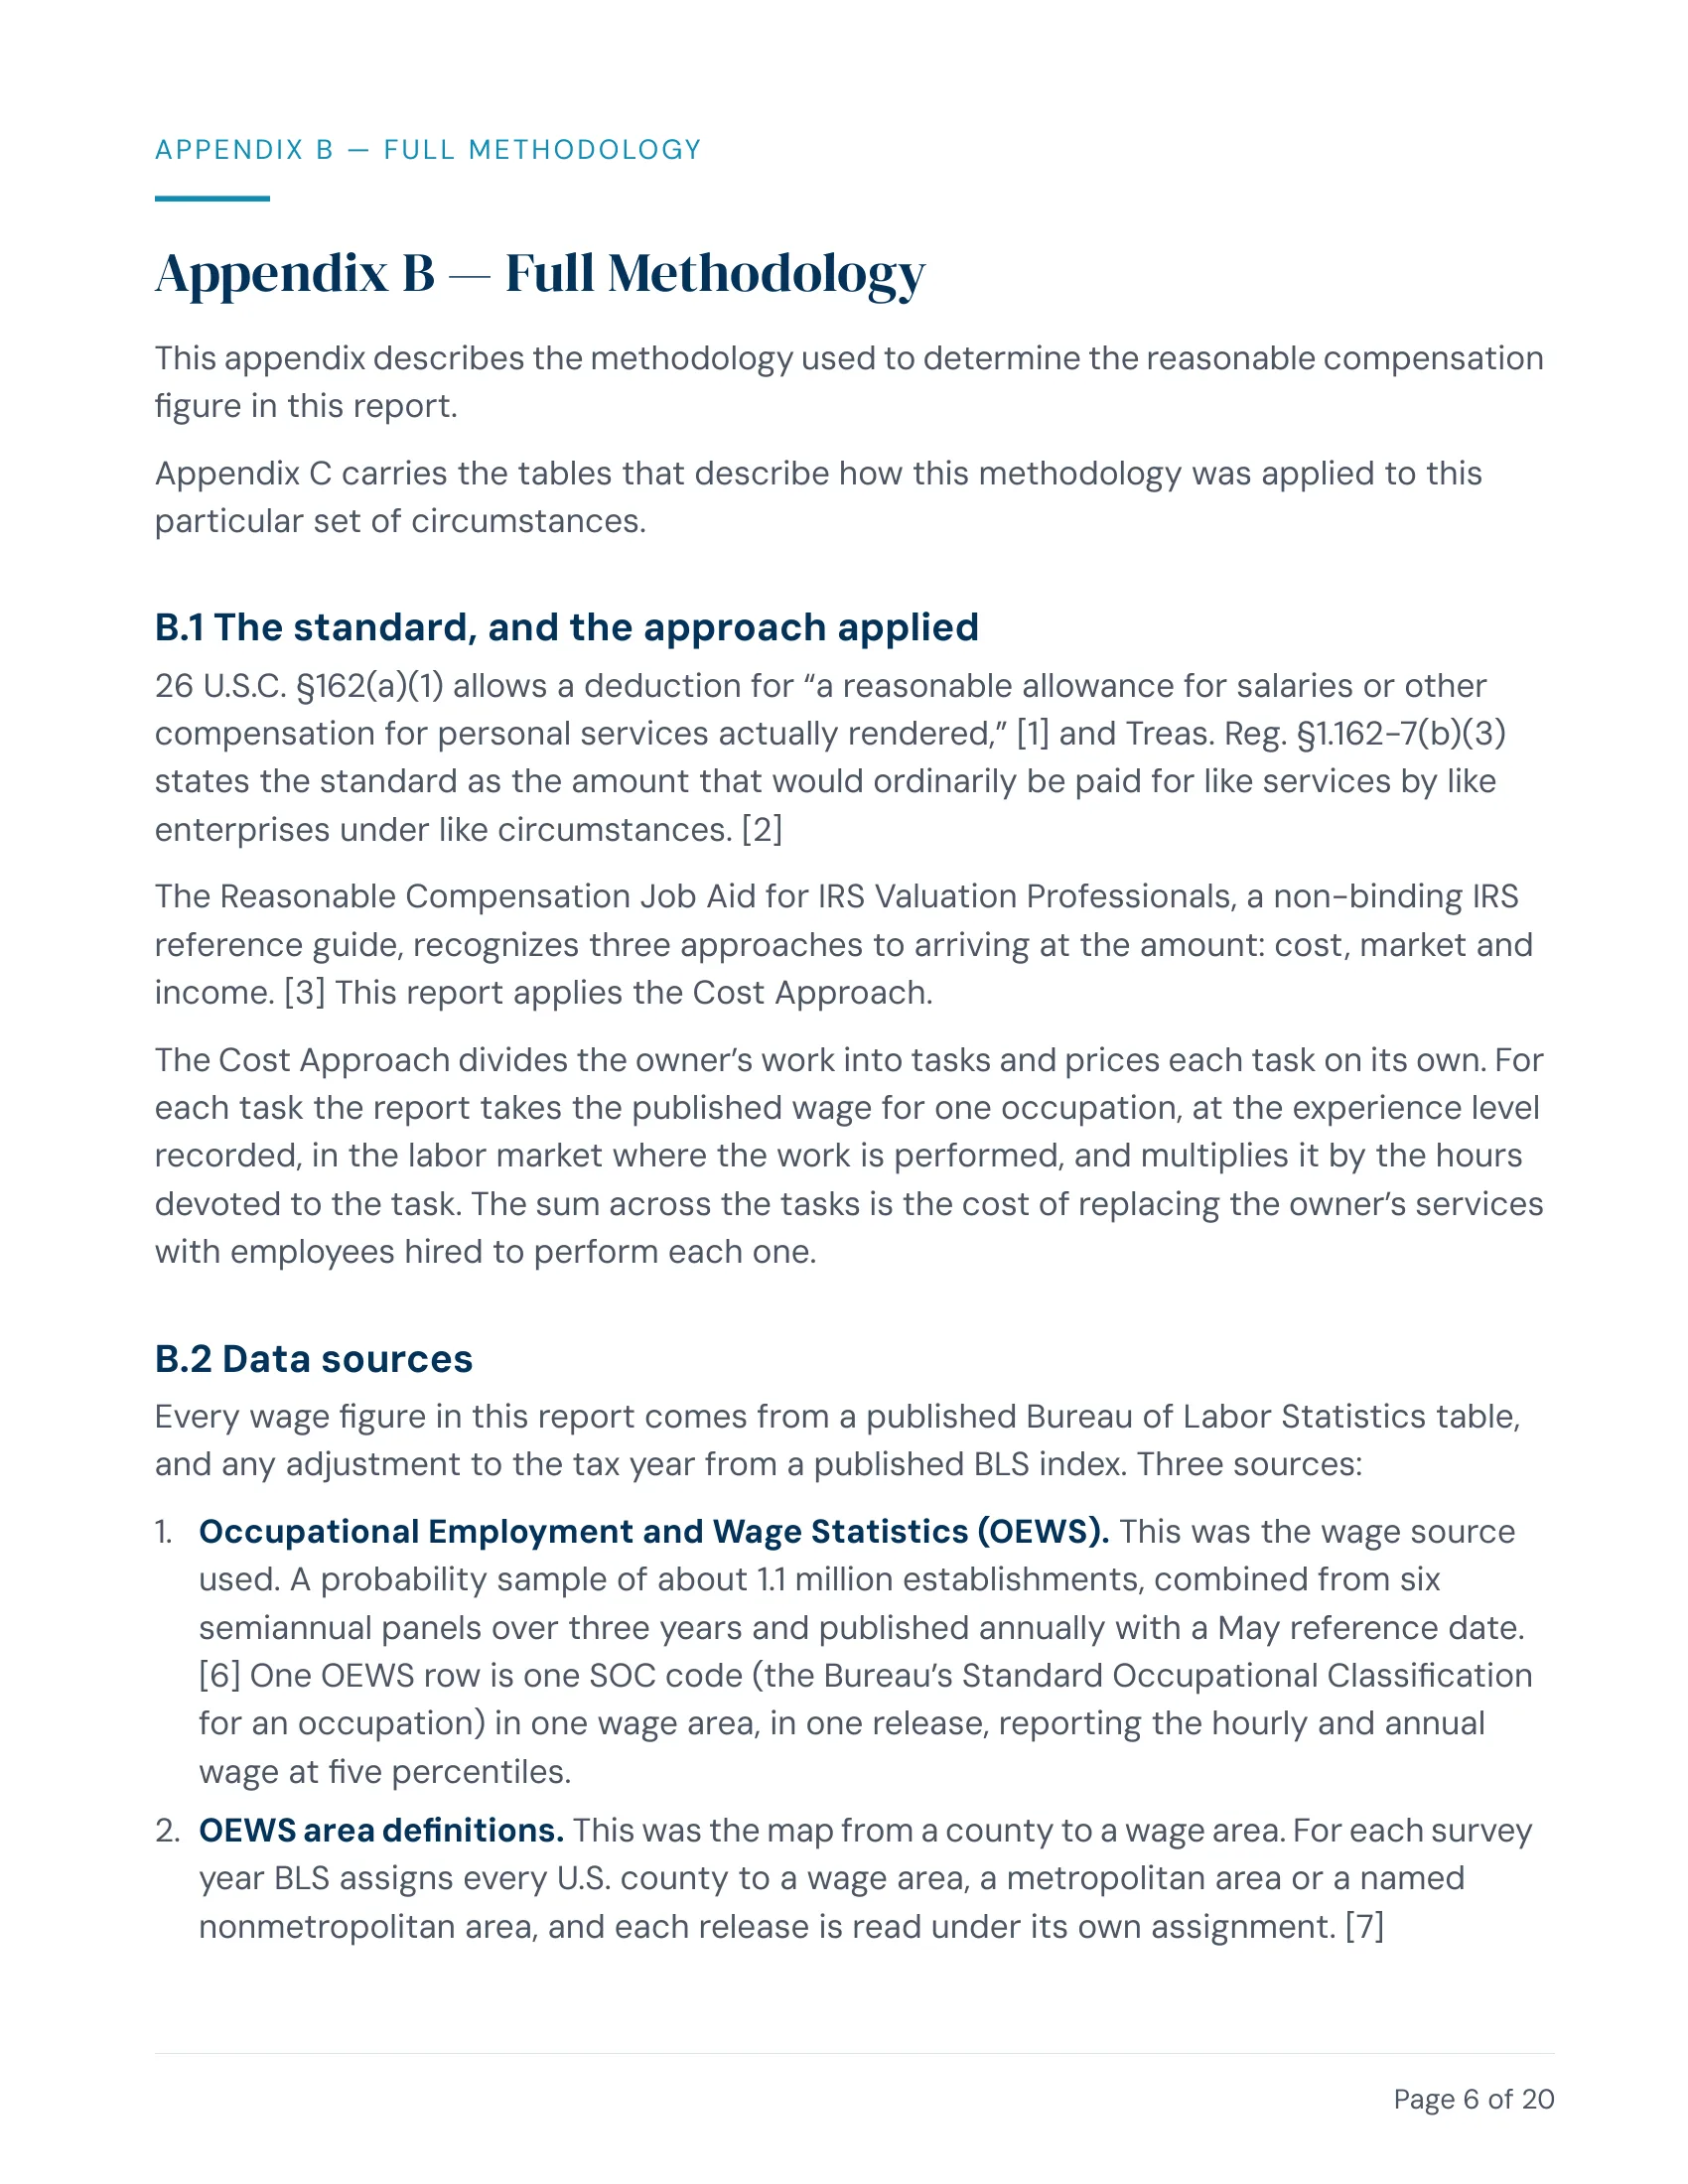
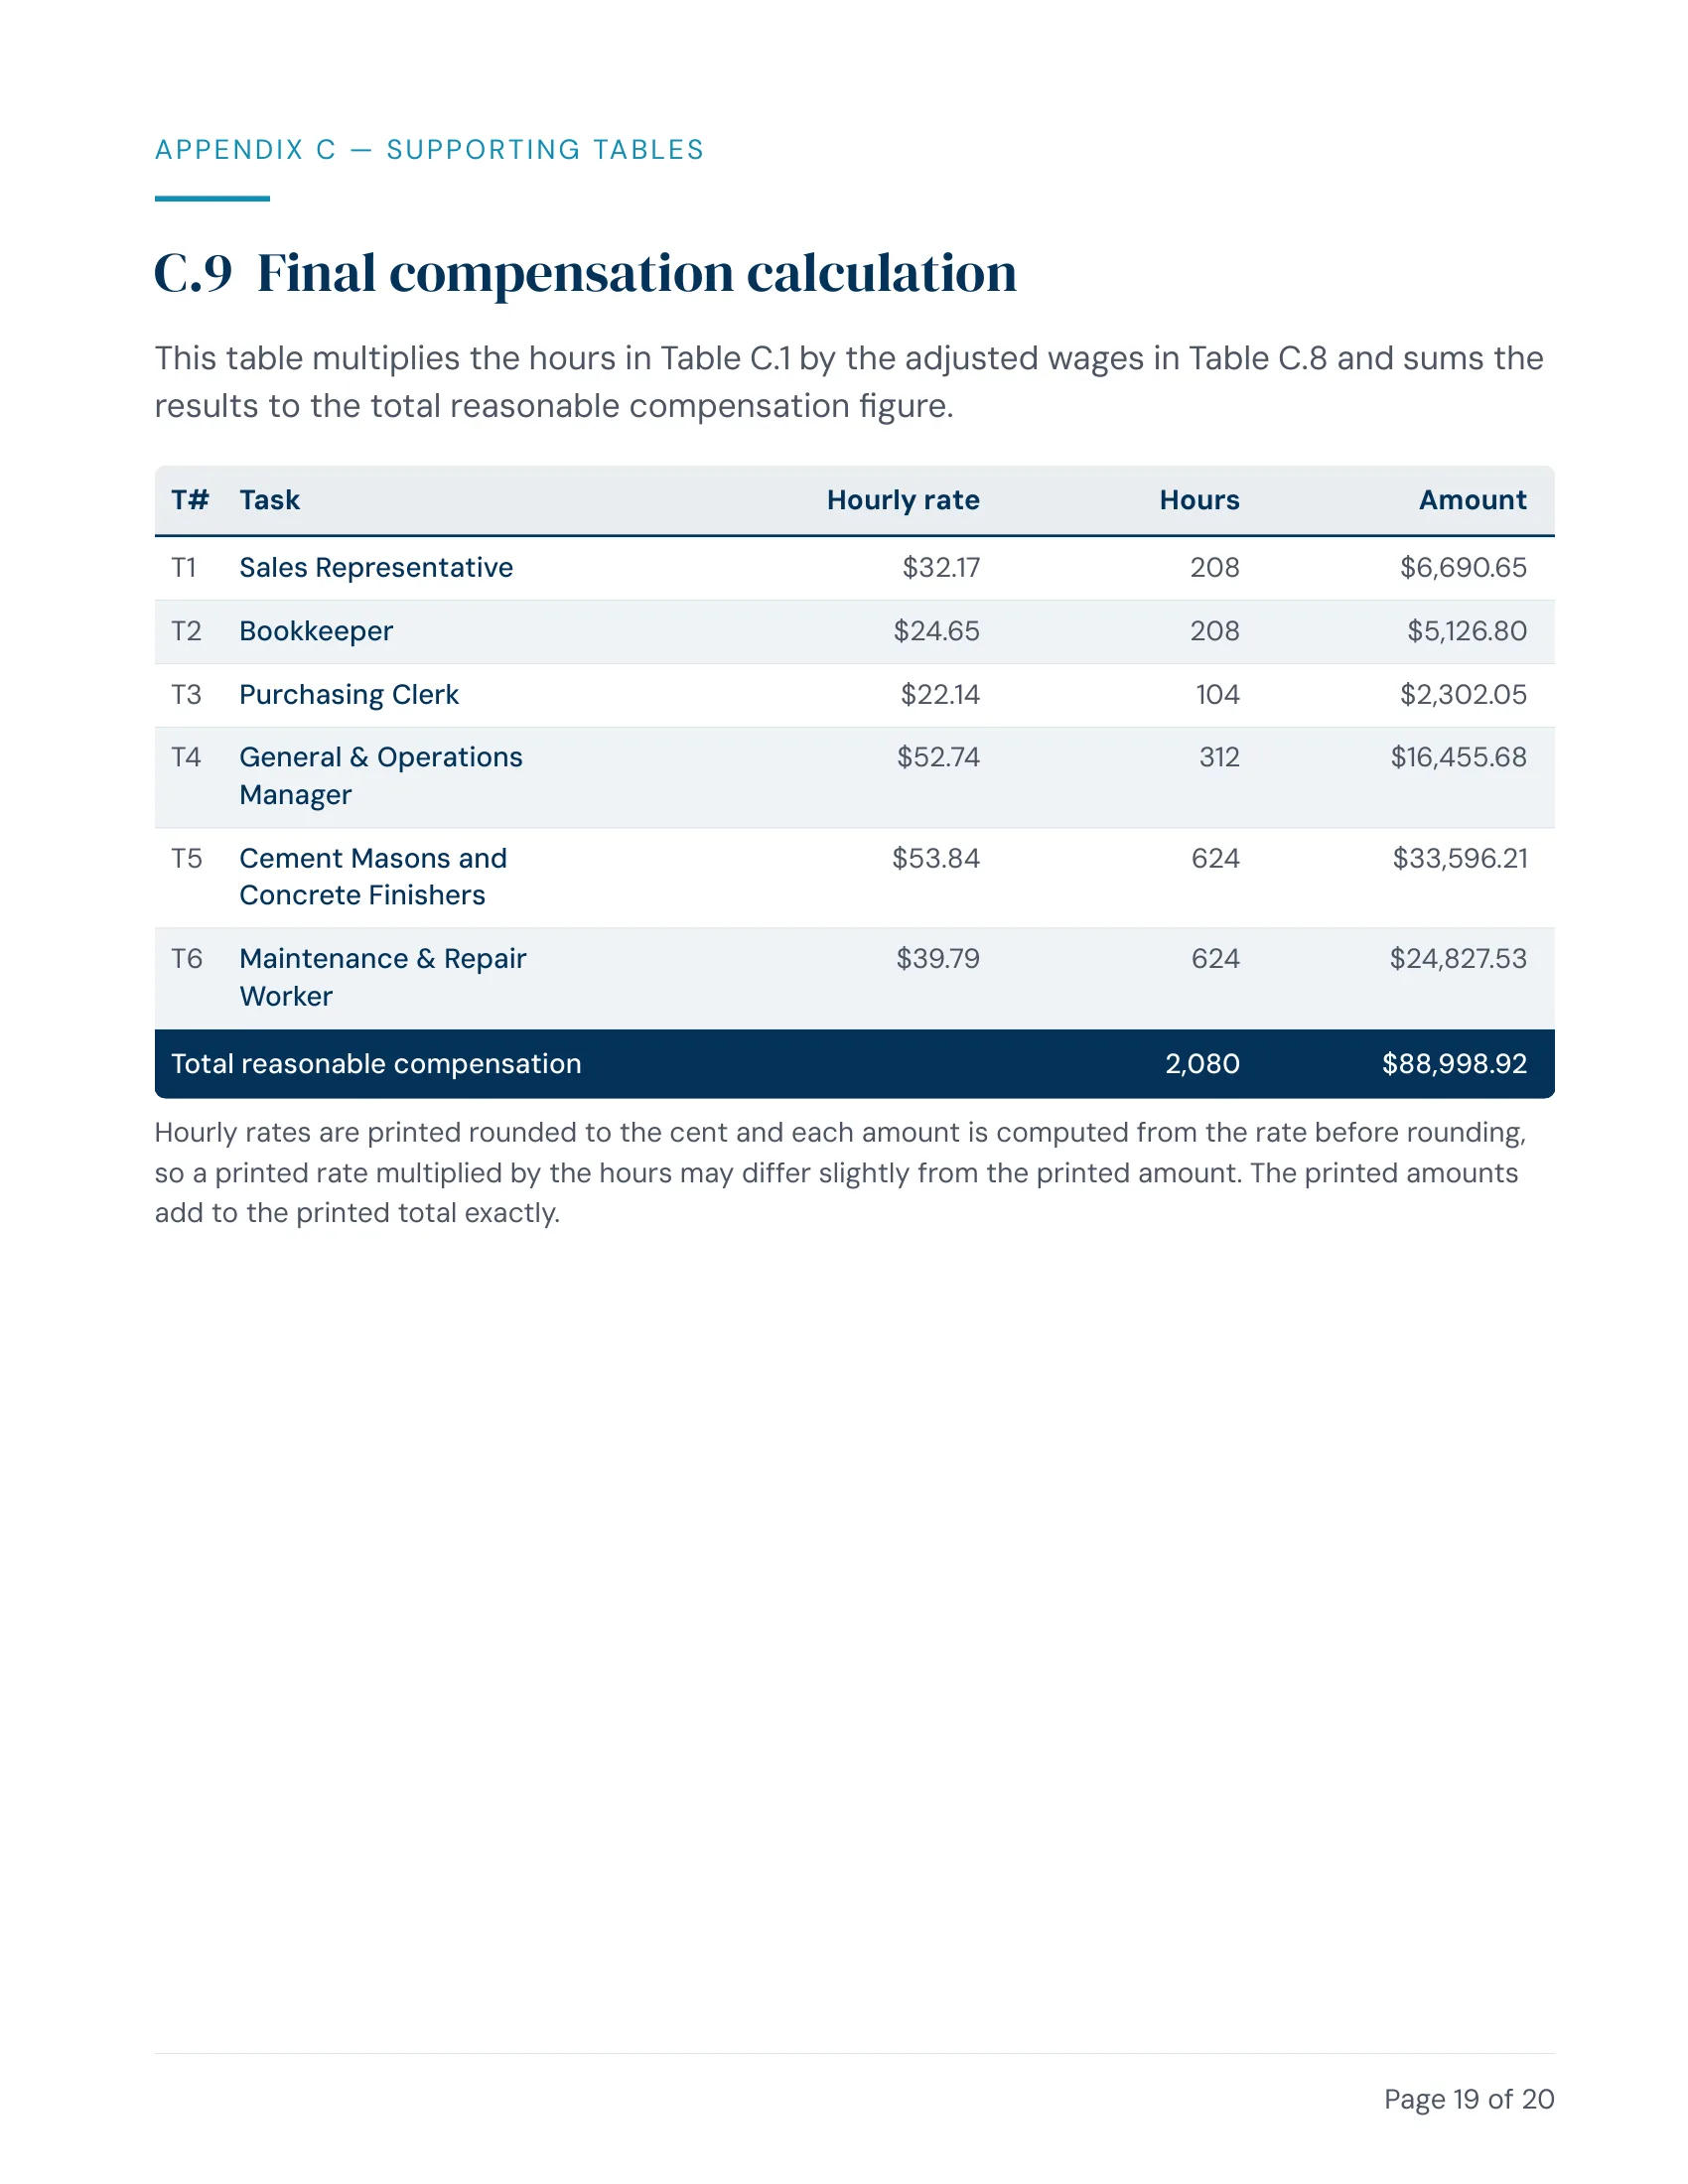
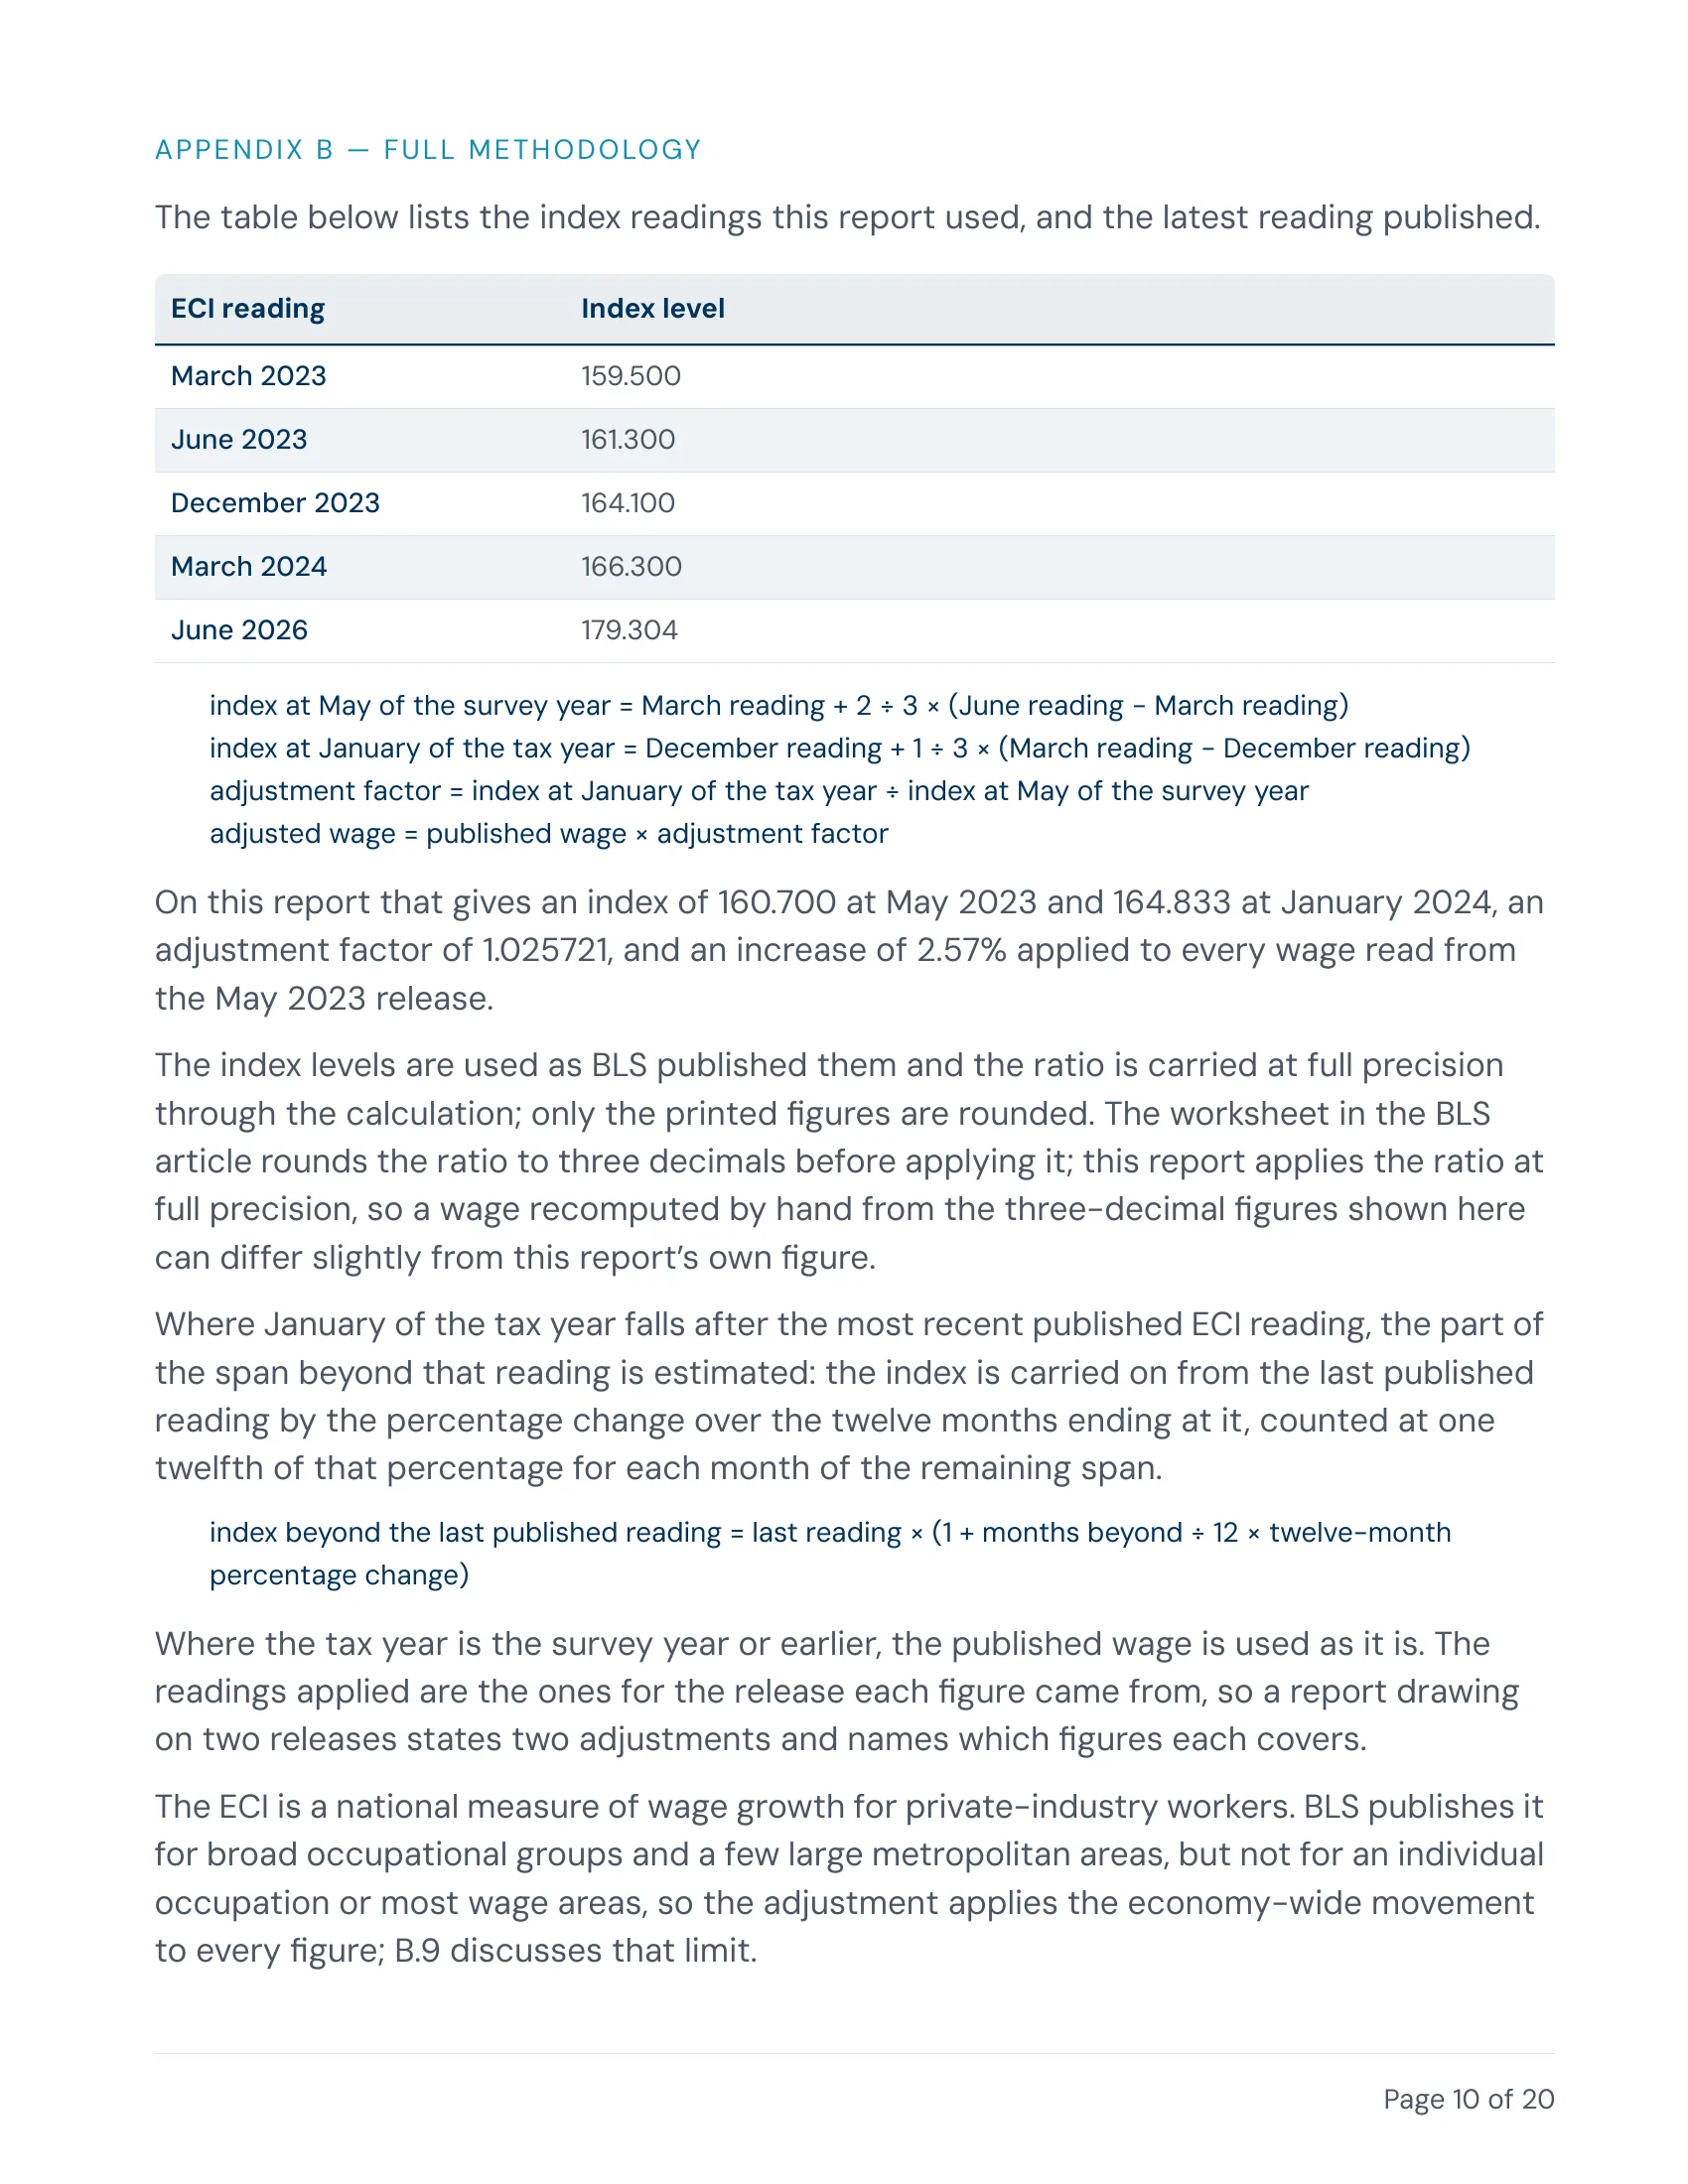
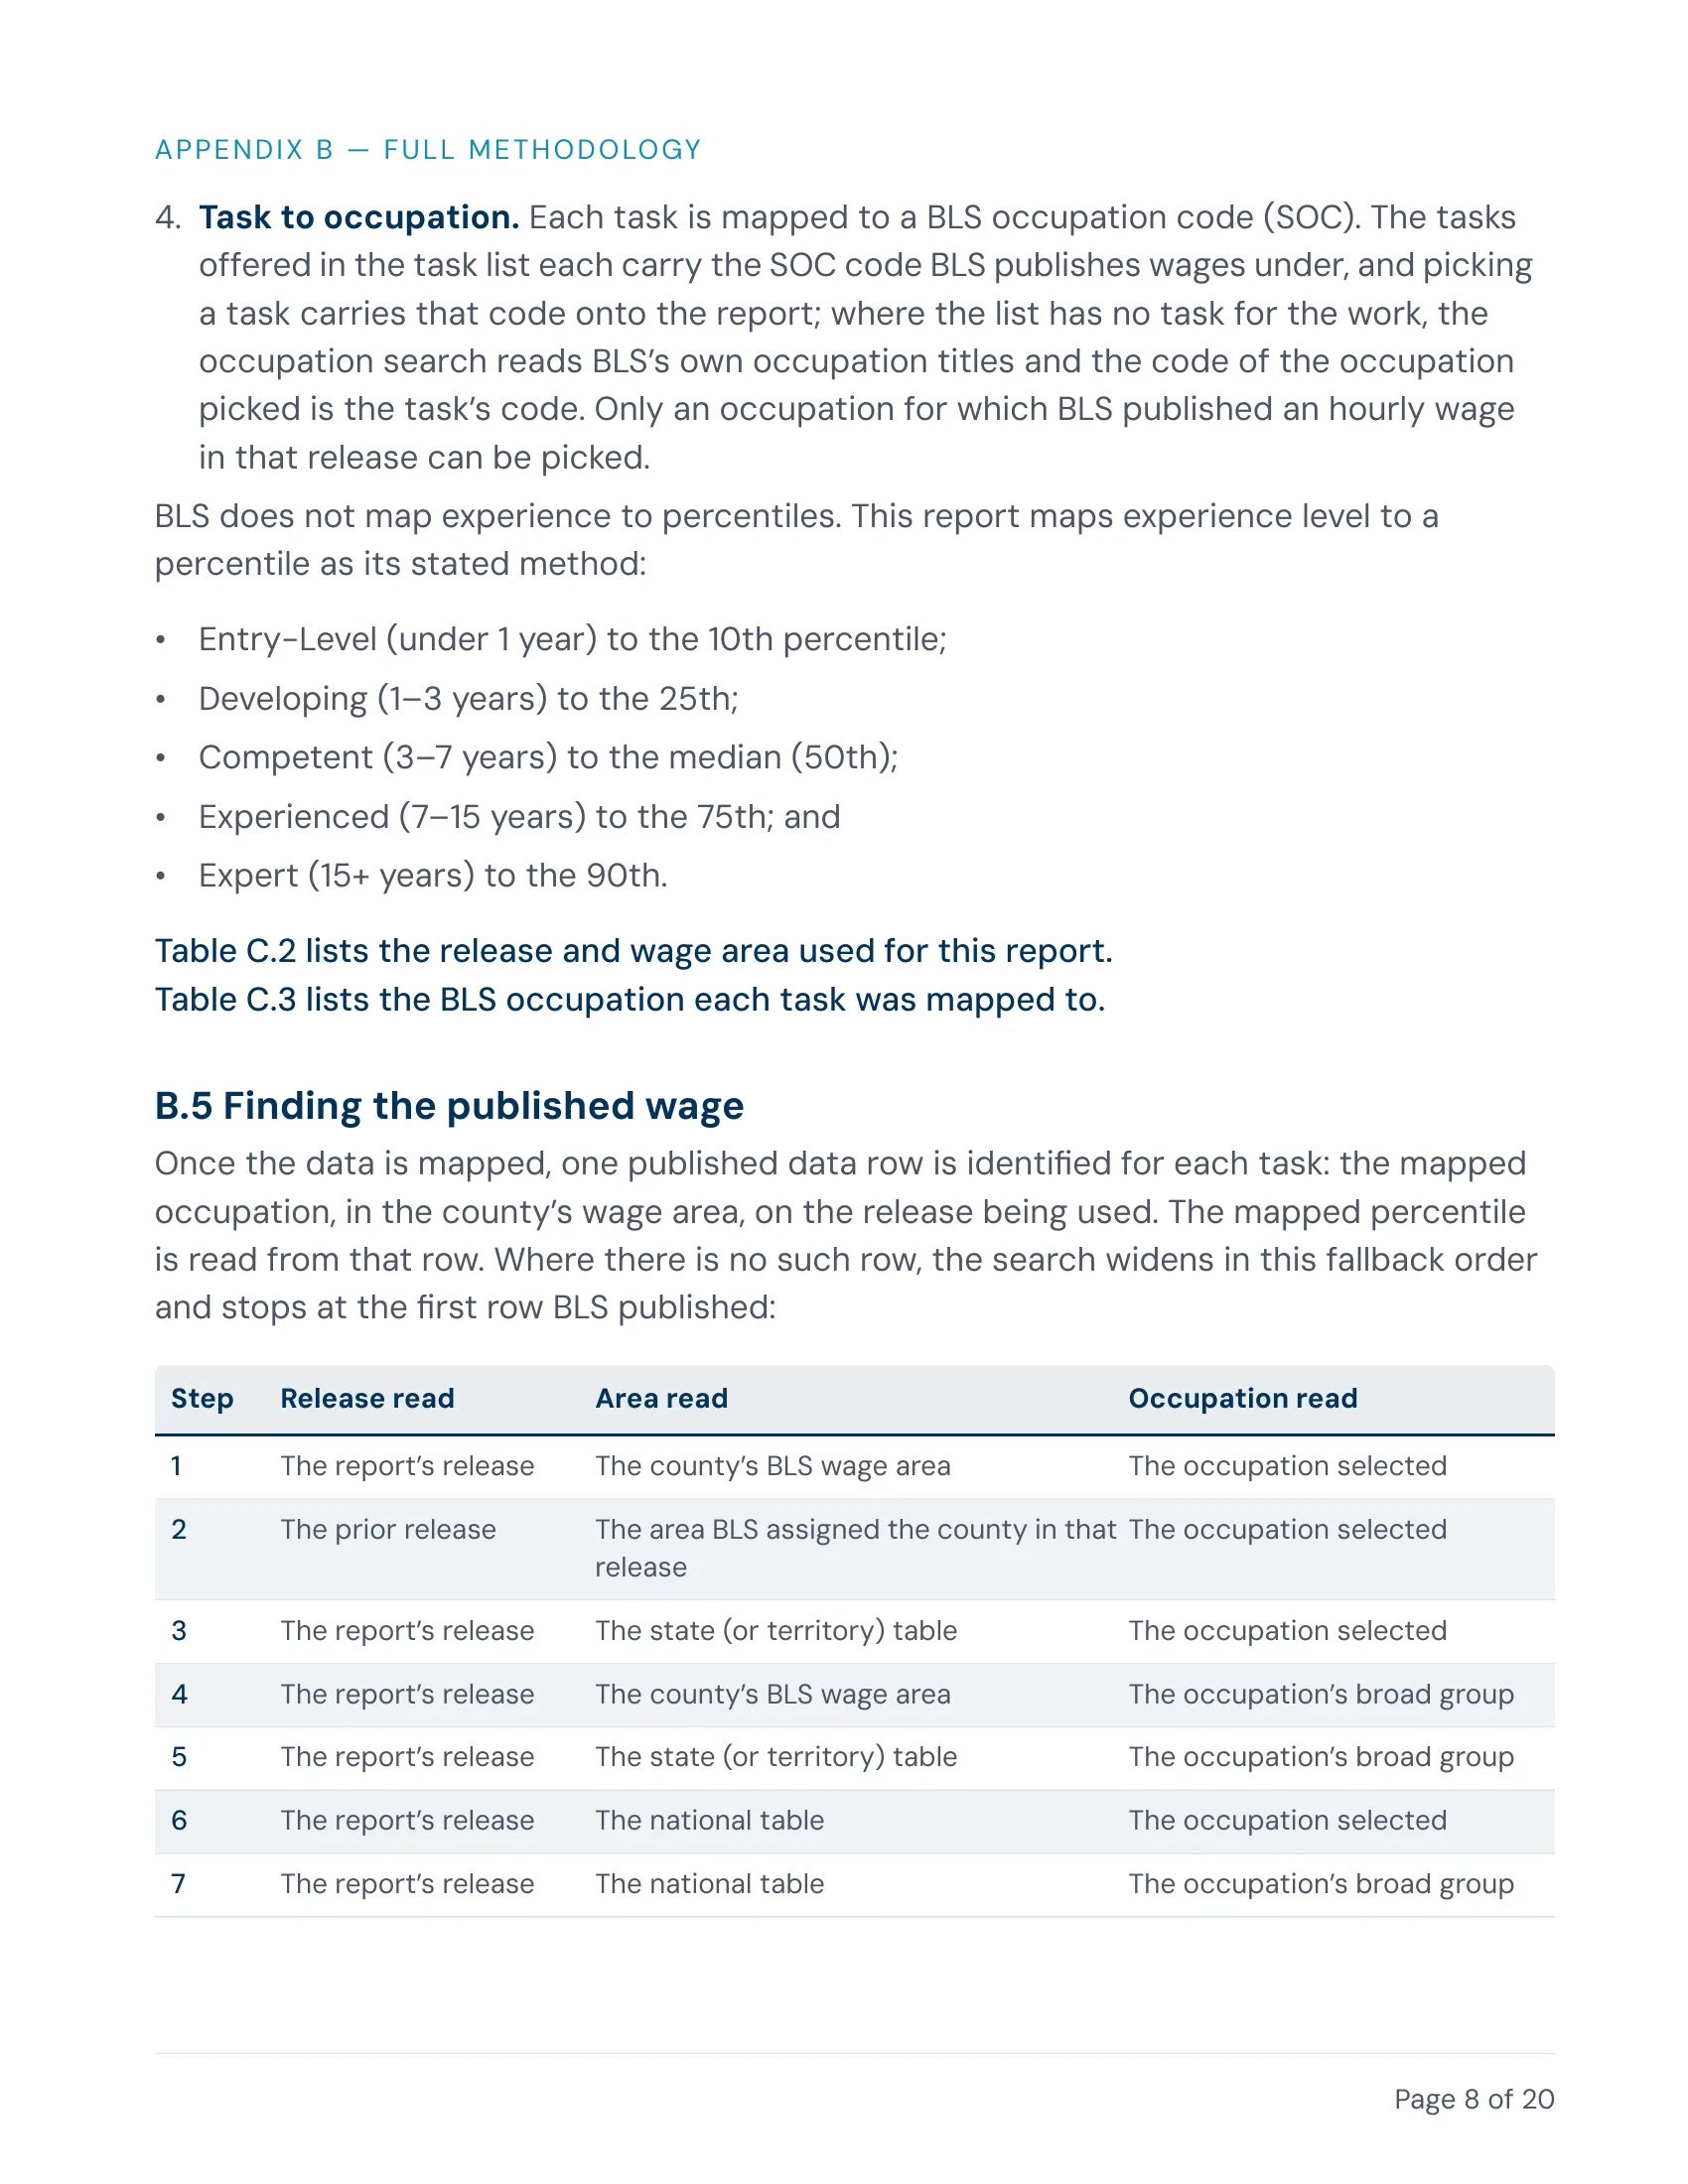
With WageProof, you get:
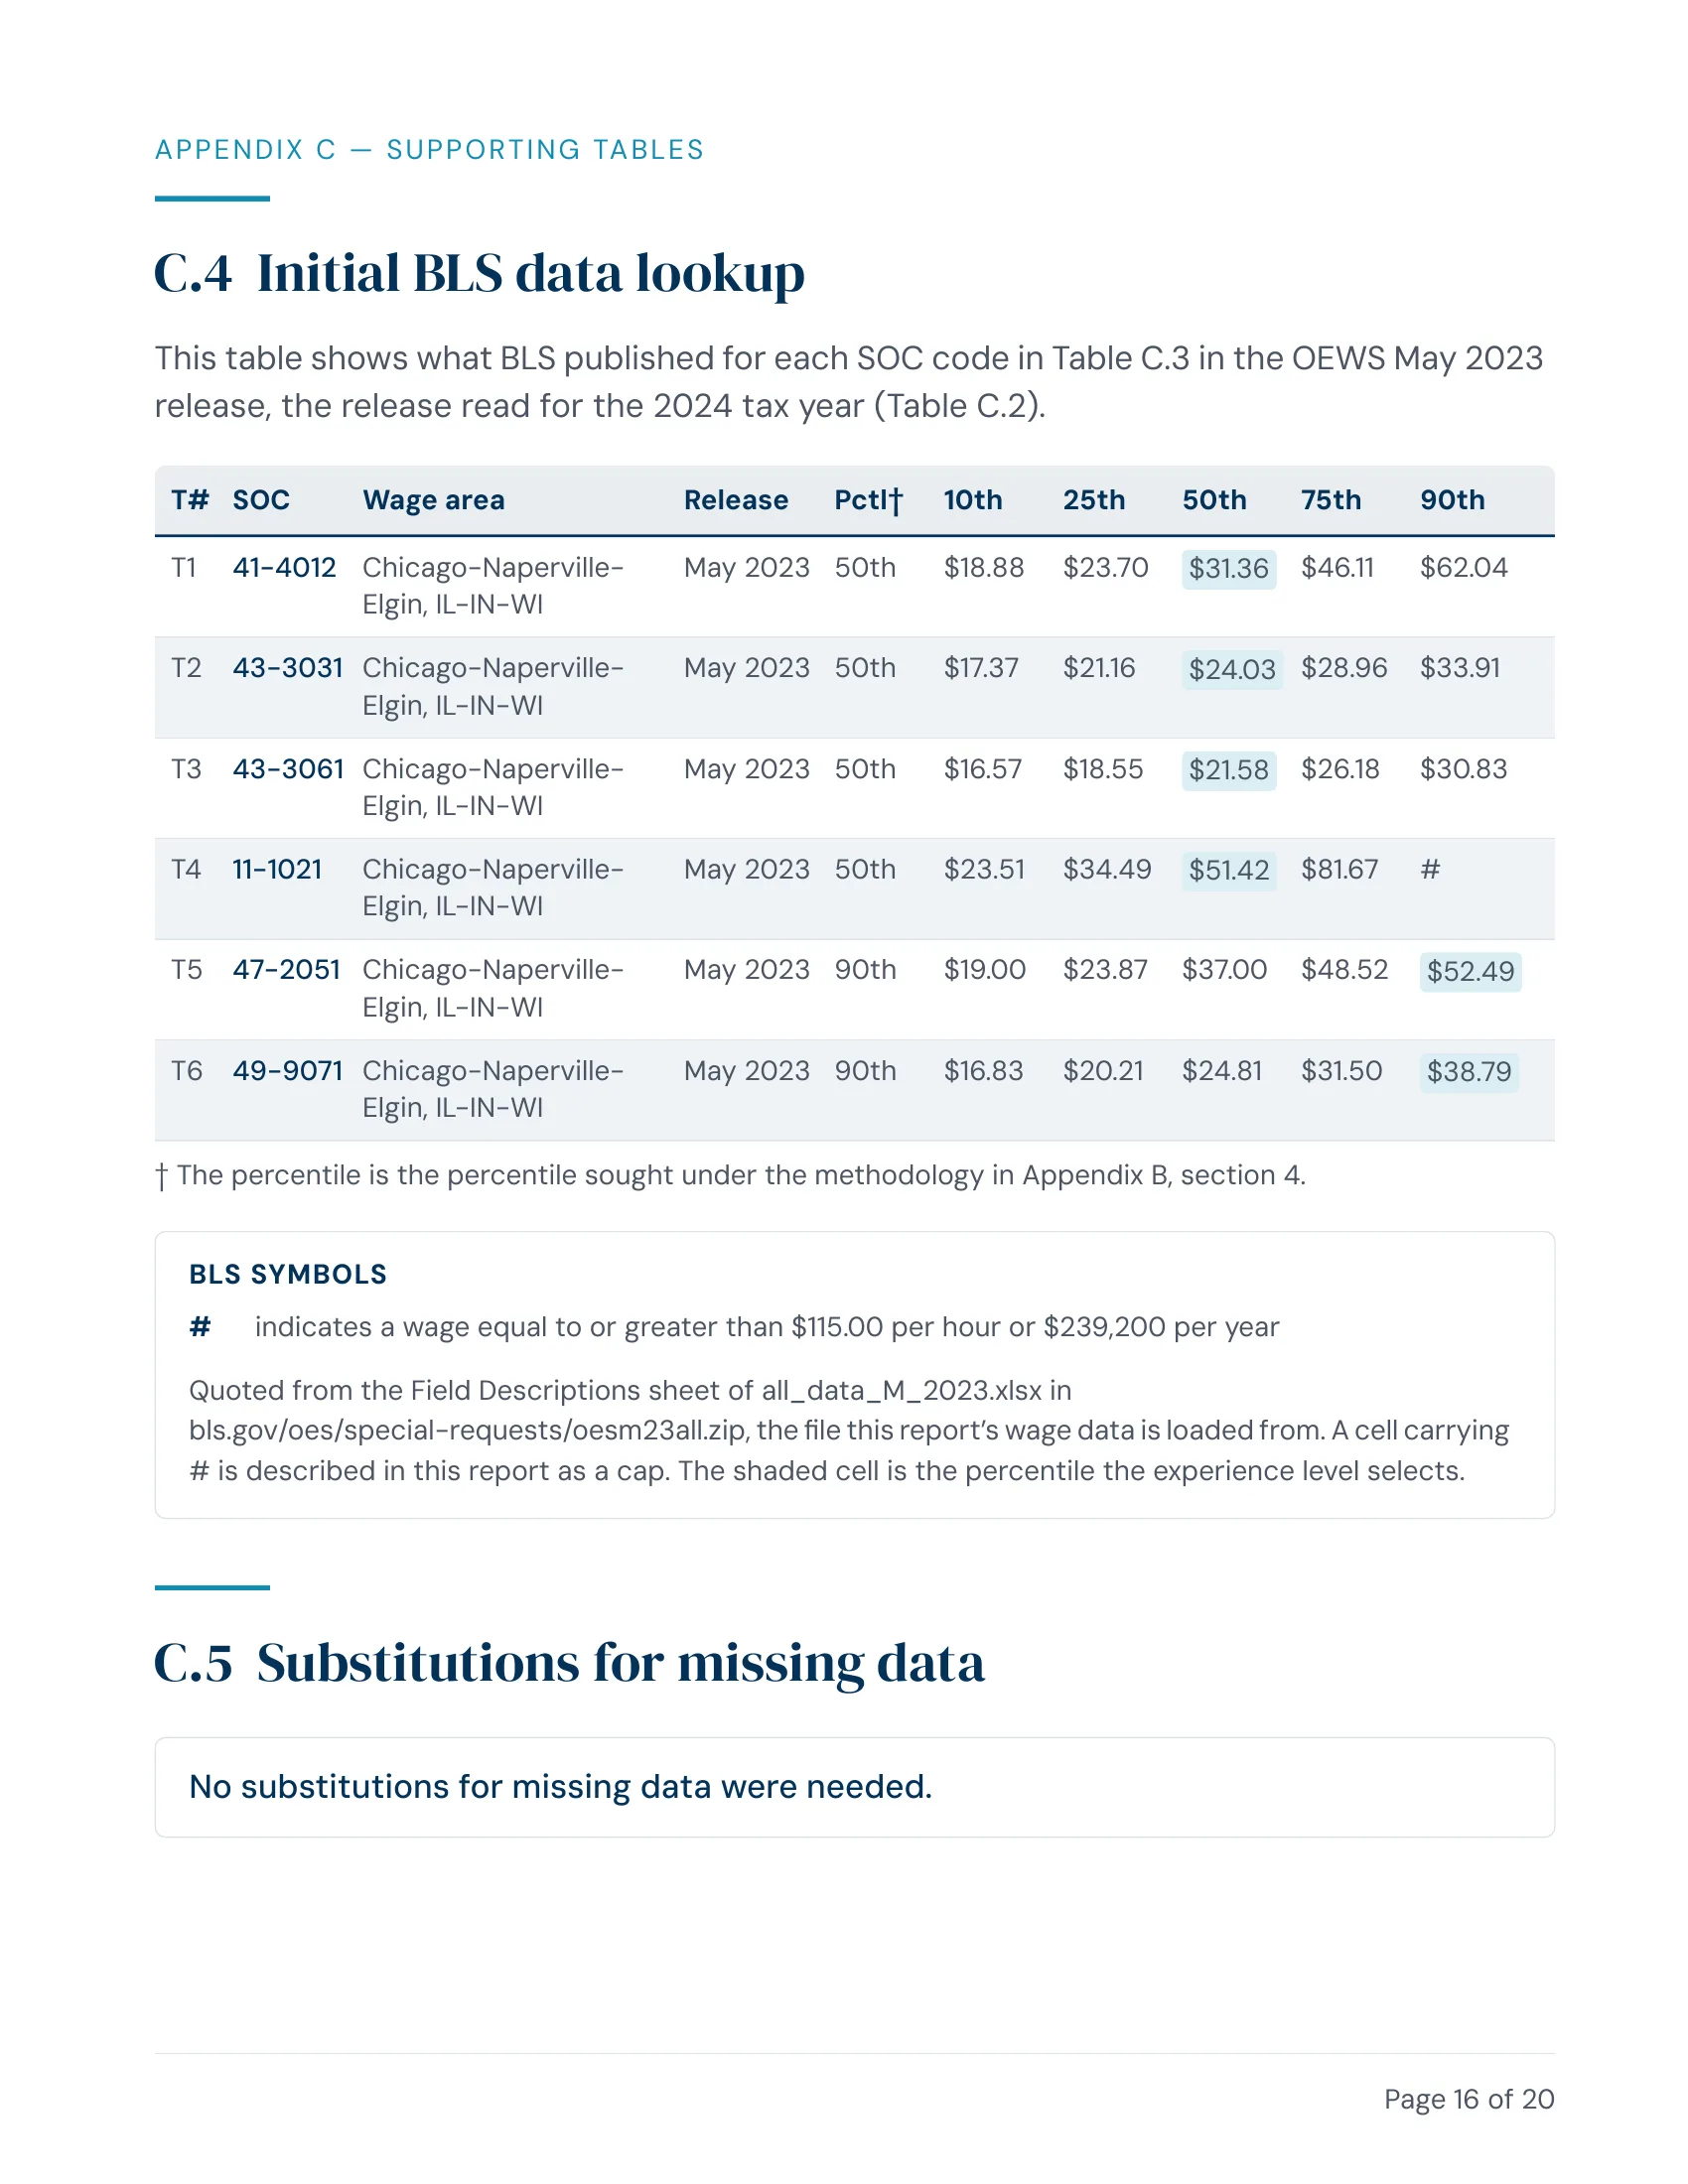
The BLS wage table
What BLS published for each job in the Chicago area, with the figure used for each task marked.
Which pay level each experience level uses
Entry level is the 10th percentile, up to expert at the 90th.
The wage-growth adjustment
The Employment Cost Index readings and the formula that carries each wage to the tax year.
The final math
Hours times each adjusted wage, row by row, adding up to the total.
Branded reports, 25 clients a year
Branded reports for less than half the price
Measured against RCReports Professional, the lowest-priced RCReports plan with custom branding. See what a firm account includes, or our standard sample report.
RCReports Professional
$2,500 a year for 25 clients
$100.00 a report
WageProof Professional
$999 a year, up to 30 reports
$39.96 a report
$1,501
less a year
RCReports list price from rcreports.com, checked 6 Oct 2026, one report per client. Tier features differ.
Questions
Scott Stone of Stone Concrete, Inc., a fictional S corporation in Cook County, Illinois, which WageProof places in the Chicago-Naperville-Elgin, IL-IN-WI wage area. Each task’s hours as RCReports split them, with “High” entered as Expert and “Average” as Competent. Tax year 2024, as an example.
A documented basis for the salary figure, not a guaranteed outcome: no report can promise how an audit turns out, and every WageProof report says so. Every wage in a Cost or Market report comes from BLS Occupational Employment and Wage Statistics (OEWS), a public federal source, and the report prints where each wage came from, so an examiner or your accountant can look it up. Subject to our Terms, we'll support you in an audit. Every WageProof report includes audit support at no extra charge: if the IRS or a state tax agency asks about the salary in a finalized report, contact us at help@wageproof.com and our team will explain how the report was built, the BLS data it used, and how each figure was calculated. It's available for four years after you finalize the report, whether or not you still subscribe. We explain the report; your CPA, enrolled agent or attorney represents you before the IRS. RCReports includes audit and litigation support in all of its annual plans.
WageProof takes BLS’s May 2023 wages for these six tasks and raises them 2.57% with the Employment Cost Index (160.700 in May 2023, 164.833 in January 2024, both printed in the report), for $88,998.92. RCReports’ rates are the same BLS wages, each about 5.8% higher, for $91,778. RCReports’ report doesn’t say how that rise is set or what period it covers.
White-label branding comes with WageProof’s Professional and Firm plans. The $199 single report carries WageProof’s own name.
Run your next client’s report in WageProof
WageProof is not affiliated with or endorsed by RCReports. RCReports is a trademark of its owner. RCReports’ current reports may differ from this sample. Ocean Tax Advisors is a fictional firm used for WageProof’s samples.